Skip to content
English
On this page

Software Project Estimation

Assertions

These are the beliefs and assertions which give meaning to much of the discussion in this book. “Certainty or safety is a basic need”—At some level every person needs safety. At the most elementary level, a person needs physical and psychological safety. This is true even when a person engages in an inherently risky endeavor like starting a new software project.

“A software team can deliver continuously within a controlled productivity range”— Modern delivery teams have mastered proven software engineering practices and have repeatedly demonstrated that their productivity can remain within constant limits throughout the duration of a project. We will take “constant limits” to mean that if there are two comparable pieces of functionality, then the team will complete these by expanding comparable amounts of effort, and we can expect this to hold true throughout the project (with the possible exception of the first few weeks when people are picking up speed).

“Project control is more important than record keeping”—On a software project, the primary responsibility of anyone involved is to take actions with the intent to control and steer the project to success. Bookkeeping is of secondary or ternary importance. The benefit of forecasting is to pull certain important decisions earlier in the project’s life. We are not forecasting to prove something right or wrong, nor are we estimating to keep a record and hold people accountable for the estimation numbers they produced.

“It is only worth forecasting when there is ability to act”—A forecast on its own does not change the outcome of a project. There must be a real possibility that we make control decisions, which lead to measured and timely actions, and change the project’s parameters. If such readiness for action does not exist on a project, and will never exist regardless of new knowledge, then forecasting becomes useless.

The People in a Software Project

Let’s start this book with a short stroll around the office to meet the people who are involved in a software project. It is important to look at their typical problems and desires so that we have confidence in the adequacy of the forecasting method and the approach to project control that we develop later in this book. It is the people, with their problems and desires, who establish the solution’s adequacy.

The People

The client (a.k.a. business person). These are the people who generate business solutions. They take business risks, sometimes having to power through considerable fears and doubt. They hustle and discover valuable things that other people need and are willing to pay for. Their ideas and resolve for action accomplish the visionary work needed for the creation of something new. Sometimes they need software tools in order to move their business ideas forward. Even when they take on a project for building a software solution, they are not software developers, rather they are business developers.

The developer (a.k.a. programmer, tester, designer). These are the people whose brains and hands perform the implementation work and bring a software solution into existence. They are skilled in software techniques and in making computer systems perform complex things. They understand how users interact with software. Many of these people can keep large amounts of information and abstractions in their brains. They enjoy seeing these abstractions materialize in the form of working software and sharing this miracle with the rest of us. A certain element of playfulness and doing things purely for the sake of having them done can be found in many software developers.

The project manager and the scrum master. These are the people charged with facilitating and organizing various project activities. They help other people make decisions and thus have an effect on how a project is being controlled. Key activities affecting decision making on a project are forecasting and scope control. While project managers and scrum masters do not themselves produce estimates, they play a central role 1 in how these estimates are used into planning, and subsequently how the plans are enacted throughout the project’s execution. The facilitation work that project managers and scrum masters perform is critical for the overall project tone and the quality of the work environment.

The manager and the team lead. These are the people who are tasked with getting the job done. They manage teams of developers with finite capabilities and less finite potential and are responsible for creating the environment where developers can do their work well. These are also often the people who provide initial estimates for software projects. They may delegate the actual estimation to their teams, but they remain personally accountable for the information that gets communicated to clients. When it comes to project sizing, Managers and Team Leads are often expected to use experience and gut intuition for producing an overall project estimate that is safe and sufficiently accurate.

Technically, scrum masters are absolved from the responsibility of planning out the full project. They only focus on helping the team work better and remove impediments. However, I consider client discomfort and uncertainty to be major impediments for the team’s work. As such, the scrum master is responsible for minimizing them. One of the things that can be done is to have a better project forecast, reliable long-term commit- ment, and a working plan for effective project control.

The Problems

A problem is something to be worked out or solved, but it is also something that allows people to self-validate and to ultimately grow as human beings. The way a person approaches their own problems has a noticeable effect on their quality of life and those around them. The way one person approaches other people’s problems has a noticeable effect on the trust and relationships they will be able to establish.

Making a decision. This is one of the main problems for businessmen and businesswomen. Making decisions is how they make their living and create the ecosystems for other people to make their livelihood too. The actual mechanics of deciding is not what creates difficulty for them, but it is the build-up to that decision which costs them time, effort, and comfort. It is a complex problem since the business context involves various bits of information and many unknowns that are all in flux. Business people deal with this complexity and handle the unknown by taking risks and venturing into business experiments.

The challenge that software projects present is the high variability of just about everything—which basically translates into more uncertainty. Some feel uncertainty is what business is all about.

Making a promise. This is one of the main problems for makers. Software developers are makers. People who make things with their minds and hands love seeing the products of their labor being used by others. Makers enjoy providing solutions to other people’s problems. A maker wants to say “I will solve your problem. Just tell me what it is.” Whether the promise is explicit or implicit, it is real, and both the maker and the client appreciate its power. How to make the promise carry through is the problem that makers wrestle with.

Making a plan. Making a plan is a problem for anyone who is accountable for seeing a project to an end. On software development projects, this is often the person tasked with project management responsibilities. One way or another, every project ends. What activities happen between the start of a project and the end of a project, and what is the result of each of these activities, ultimately have a crucial impact on whether the project ends successfully or not. Consequently, identifying the activities with the best chance of contributing to a successful outcome is of primary interest for a planner.

Typically, there is an expectation, or at least a wish, for a reliable plan to be in place sooner rather than later through the life of a project. Even when the “plan” is to simply work through the mountain of challenges, the project manager is expected to guide the effort on a path of success and to have sufficient foresight into why the chosen path is the one leading to success.

WHO CARES! It is easy to say “Don’t promise” and “Don’t plan.” It is less easy to say “Don’t make decisions,” although some people do say it in a roundabout way. Even though these approaches look seductively simple, and there is a hint of bravery in choosing them, none leads to a satisfactory solution. They invariably lead to unwelcome compromises that people need to accept at the expense of comfort and happiness.

In the context of a single project, managers have a similar problem to planners; they want to see the project on time. And business analysts have a similar problem to makers, that is, they need to see their work materialize and produce valuable results.

The Desires

An adequate solution should solve a problem and align with desires. So let’s make a few more generalizations. You will notice this as a pattern that applies to estimation and forecasting too—by making careful simplifications we can get good enough understanding of a complex problem.

To make decisions on reliable information. For business people this is one of the primary desires. By the nature of what they do, they need to make so many decisions that any opportunity for making a quick and clear decision, based on little but reliable information, is welcome.

The next best thing is the knowledge that reliable information will be available at a defined moment in time. When businessmen and businesswomen are faced with uncertainty, they can tolerate it for a while, but it helps them a lot if they have an idea of what to expect once the waiting is over. Why is this important? It is important so that we can properly sequence the input we are providing to people who are making decisions. We need to appreciate what suits them best at a given moment in the life of the project.

This makes communications much more meaningful and allows us to move through seemingly difficult situations with ease.

To be able to work. Makers and artists, which software engineers are, enjoy working. They like being useful and spending time tinkering with whatever happens to be in their field of interest. What they typically don’t enjoy is to deal with something they cannot perceive to be real, valuable, and true. They markedly dislike the situations where they are the originator of things with questionable worth.

For makers, it is preferable to describe a complex problem in a complex way, rather than sacrifice the truth and provide simplistic and untrue answer. Makers can bend a little and deal with uncertainty, but only for short periods of time. They prefer to spend their time making things.

Why is this important? Because it is important to understand that software developers detest estimation, and forecasting by extension, since they cannot be proven to be true. They are only a guess. And for makers a guess represents little value. For this reason, we need to be sensitive and empathetic to their dislike when we need their input and cooperation. When developers see that we understand the binary unsustainability of our own request, they will oddly be more willing to help. But it is also important for another reason—when developers see that our forecasting efforts are ultimately designed to provide them with a more sensible environment for work, there is a material improvement in the relationship’s dynamics.

To be able to apply control. For people who make plans and who are responsible for delivering a project, like project managers, team leads, and scrum masters, it is highly desirable to have control over how things roll out toward the project objective. Of course, a project manager is not judged by their ability to strictly follow a rigid plan. Rather, the project manager is ultimately valued for their ability to deliver a satisfactory project, changing plans if necessary, and even steering in the absence of a ratified plan.

Guiding things along a known plan of action is typically easier than making all the right calls in real time without the benefit of planning and anticipation. A plan provides a useful reference and an opportunity to rehearse some scenarios in advance. It puts us in anticipatory mode and not in reactive mode of being. In this way we can roughly gauge if things are panning out well, and we can set interim course direction which helps us move through obstacles without getting distracted by too much fear and unnecessary considerations. The more control a planner can exert on how work is being completed during the execution of a project, the more likely it is the end result agrees with the plan and, by assumption (please see the side note), with the expectations and wants of the people affected by the project.

PROJECT MANAGEMENT? SO 20TH CENTURY! Waterfall is a method for software development and project management, which relies heavily on thorough and exhaustive preplanning. It has come tobe that Waterfall is a bad thing in many cases, mainly for not being able to adjust to reality. Planning and software project management, as practices, have been associated with Waterfall for so long that many people treat them as equivalent. We need to separate them though, because they are not the same. There are ways to plan and to manage a project that are dramatically different than what Waterfall has established as a standard. The Manifesto for Agile Software Development (https://agilemanifesto. org/) 2 says we (the software developers) value responding to change over following a plan. Suggesting that following the plan might be the better thing to do sounds like a contradiction to the manifesto. However, there are two assumptions, or rather oversimplifications, which are baked into this particular postulate of the Manifesto for Agile Software Development. The first is that we value responding to change only when we have assessed that the change merits a response. We are not merely responding to any change that comes along. The other is that we value responding to change over following a static plan, not over following a plan in general. A plan can be revisited and adjusted (even within the constraints of a contract). When the plans adapt to the relevant changes in reality, we can confidently follow these plans, while simultaneously responding to change.

Here, we are talking about effective project control—steering the project reliably into producing the desired outcomes. For example, having power control over people’s overtime is not effective control in this sense, while minimizing context switching by suggesting or enforcing a smaller WIP (work in progress) rule, or by improving feedback time, can be considered an application of adequate project control.

WHAT CONTROL?

In this book, when we talk about control, we are talking about project control. And we are explicitly not talking about control over people. There are three primary project controls we can manipulate:

  • Scope—controls the “what” of the solution

  • Effort—represents the power we apply toward building the solution

  • Duration—represents the time we have available for finishing the project

By adjusting each of these controls within the project envelope, we can affect the project’s progress and ultimately can drive the project toward desired objectives. There are other project aspects that can be recognized as distinct secondary controls. They have direct and indirect impact on the primary controls, and they are also very important in their own right for managing the less tangible outcomes of a project. These are the Environment, Software Quality, Metrics, and Value.

Environment, the well-being and collaborative capacity of people, can be treated as a secondary control. It almost directly converts to Effort— motivated people deliver more effectively. In this sense Environment can be considered part of the Effort primary control, and by improving the environment, we increase the available effort that can be expanded toward the project goal.

Software Quality, the well-being and capacity for change in the code base, can also be treated as a secondary control. However, for most teams this is only a theoretical control since the quality that the team can attain is constant (and maximum) within the envelope of a single project. Lowering the quality is of course possible, but it cannot be considered a control since it doesn’t make sense. In any case, improving software quality, if it can be done sustainably within the project, also translates to Effort because once the team is working at an improved quality level, they get to expend less effort for achieving a comparable result.

Metrics, the health of the adopted development processes. Driving toward more controlled processes improves the predictability of events on the project and the likelihood of a forecast being close to the actual outcome. To the extent that an improved process can be proven to facilitate better productivity, we can consider it an effective project control. However, let’s not forget that individuals and interactions come before processes and tools. Enforcing rigid processes will backfire when creativity and thinking are the primary activities of people (which is the case on software development projects).

Value of the end product. Prioritizing functionality, so that we first complete the more valuable pieces, is a critically important derisking technique. Prioritization is a variation of the scope control. Occasionally people will discover valuable functionality that has not been previously recognized as an objective for the project. Pivoting for value represents product control, not project control. However, the value of the end result is so crucial for the project success that the project must accommodate changes to scope where this has been deemed the correct course of action. If the change in scope cannot be contained within the current project envelope, then the whole project needs to be reframed.

It should be noted that within the context of a given project, the appropriate and sufficient value is assumed to be guaranteed by the project’s definition itself. A project starts with a specific goal, and it is expected that this goal has enough value to justify the project.

With forecasting we are seeking insight on where and when to apply project control.

Summary

There are a few typical roles on any software project. Sometimes these roles might be fulfilled by people whose daily roles are different. For example, a developer might be a maker primarily, but can double as a project manager and planner. It is less likely to see a business person play the role of a maker and deliver solid software code, but it is not unheard of.

Clients, developers, and facilitators (scrum masters, project managers, team leads) have various problems and desires. Most of the time they prefer to do what they do best. People don’t mind occasionally spending time on things they do not consider their primary interest, and they don’t mind temporarily hanging in suspense, but they seek the things that make them comfortable and happy. They desire some form of certainty and autonomy.

Outside these generalizations lies a diverse set of highly nuanced human wants, fears, and relationships. But the bulky characterizations we discussed in this chapter define the landscape on most software development projects.

The Role of Simplification

In this chapter we look at simplicity and explore why it is good to keep things simple. We will go over a few concepts that will allow us to view complex matter through simplified but correct models.

A model is a composition of ideas that help us understand a subject that the model represents. A correct model is one which introduces little or no skew to the particular aspect of interest, that is, there is a reliable mapping between what we understand through the model and what we would see if we were to look directly at the subject we are examining. A model can provide significant simplification and still be correct for a given purpose. For example, if we are considering shipping books through the mail, then modeling a book as a solid box with some weight might be a decent simplification.

An oversimplified model distorts reality in a way that makes the model unac- ceptable for what we are trying to accomplish. An overly complicated model is too hard to work with and is not worth the knowledge it provides—even if it’s a correct model.

For example, if we model the book as simply a “unit,” it might be oversimpli- fied. Consider: “I will ship 4 units.”—it doesn’t carry the necessary information for size and weight. On the other hand: “I will ship 4 reading doohickeys, each consisting of two 6"x9" flat unbendable cardboard surfaces hinge-attached longitudinally along the 9 inch edges and encompassing a set of 250 collated flexible paper sheets suitable for printing” is overly complicated, useless, and probably wrong, even if we could derive the weight and size of each doohickey.

When looking for simple solutions, it is important to keep in mind that we still want a true representation of the reality. Sometimes, to stay true, we need to combine a few simple concepts and even build a more complex model—as long as it is not significantly more complex than it needs to be, the solution can be considered simple in the context of the specific problem. Why is simplicity important in the context of software estimation, forecast- ing, and planning? One of the reasons is that these activities do not represent a primary interest for any of the people on the project. Business people want to make decisions and move on. Developers want to be working and creating software solutions. And project managers want the project to be rolling, and they want to be able to control it toward a successful outcome. And while everyone on the project understands the importance of a sched- ule, it is not the schedule or the plan itself that makes anyone happy. Thus, it is best if this aspect of the project planning 1 is approached in a simple and painless way.

It is useful to examine simplicity on its own before we try to capture it within the specific techniques for estimation, forecasting, and planning. This will allow us to confidently accept the validity of the method discussed later. Whence this chapter.

What’s Wrong with (Overly) Simple Answers?

Simple answers are very much okay and desirable when they reflect a similarly simple reality. But software projects are rarely simple. Thus, providing a simple answer to almost any question about a software project risks oversimplification. For example, let’s consider the simple question, “When is this project going to end?” This can be easily answered by producing a calendar date—July 2nd. A simple answer like this leaves too many unanswered questions which are implied in the original inquiry. Is the project going to be successful? Is every- one going to feel it was a successful project or only some people? Is the project goal going to be met fully or partially? Is there anything else that needs to happen for the project to be useful?

It is unlikely that someone on a project cares only about the end date. The reality for which people care is complex, and it is also constantly changing. Producing overly simple answers in this context is not adequate. But some- times people get lazy and want to get rid of the problem with a silver bul- let 2 —a single metric, or a single best practice, a single simple answer. And instead of simplifying the matter, they only introduce uncertainty, increase the likelihood of misunderstanding, and ultimately reduce the chances for a suc- cessful outcome.

It is important to distinguish between the portion of planning, which takes care of the schedule, and project planning in general. Project planning encompasses a diverse set of business activities which can be immensely interesting to many people. We are not talking about that planning here, and we will limit ourselves to discussing the part of it which deals with estimation, forecasting, and scheduling.

What’s Wrong with Complicated Answers?

Complicated answers do not instill trust. They require too much intellectual investment to be understood, and they are only adequate when everyone is deeply interested in the subject matter in question.

When producing a project forecast, we need to be careful with exposing the underlying complexities. People will increasingly doubt the forecasting method with each layer of complexity.

What people need is a simple and fast process—producing simple and trust- worthy answers.

Complicated answers are not always unwanted. Some of the speculations we make during forecasting depend on nontrivial relationships among things. We want to hide these when possible, but if someone is explicitly inquiring about the source of our reasoning, we should be able to dive in and provide satisfac- tory answers regardless of how complicated the reality around them happens to be. In a scenario like this, maintaining simplicity will frustrate people more than inadvertently overcomplicating an answer.

Simple Constructs That Capture Complex Reality

Range. Range is the more adequate alternative of a singular value in almost any project context. For example, if a client asks “How long do you think this project will be?”, an answer of “11 months” can be suspicious, while the equally simple answer of “Between 10 and 12 months” can be satisfactory and more adequate.

Ranges allow us to say things that are sufficiently true. These statements gen- erate all the trust needed without exposing the underlying complexities and uncertainties. Of course, if we answer “Between 6 and 16 months,” we are just as correct (or more), but the uncertainty increases unacceptably. The client will have the same doubts as if we hadn’t provided an answer at all, only now they will also question our ability to adequately understand their problems. The answer “Between 10 months and 20 days and 11 months and 10 days,” which can be correct and very precise, triggers similar suspicions.

To build a meaningful range, we need to know the answers to two questions:

  • What is an adequate accuracy for the listener? This can also be called “acceptable error.” It is a value that represents how far off the true answer someone is willing to go and still consider the result good.

  • What is a meaningful and sufficiently true value that the range should encompass?

Often, guessing is acceptable replacement for knowledge, so we don’t really need to know the exact answers to the two questions, but only to be able to guess them with some level of comfort. Try this next time you are challenged to produce a seemingly simple answer, especially when it is about estimates and dates—instead of a number, produce a range. If people still insist on a singular answer, then use “most likely” and pick a value within the range. We talk about probabilities later.

Conditionals. Conditionals help us when there are a few possibilities that would make for an unacceptably wide range if we were to wrap them all into a single range. Sometimes an answer can be dramatically different based on various factors. Instead of producing a single range encompassing the many possible outcomes, it is better to have an answer that represents the disparate possibilities.

For example, when talking to a client, instead of saying, “This project might take between 8 and 12 months,” we can say, “This project will take between 10 and 12 months if we add Chris to the team. And it will take between 8 and 10 months if we add Avery.”

By using conditionals we provide the client with a clearer picture at the expense of minimal extra complexity. The end result is a simple reality for the client.

If we spare the conditionals and provide a wider range, say “between 8 and 12 months” from the preceding example, we overload the listener with a differ- ent type of complexity—they need to consider whether the range is accept- able to them in its entirety. It may be that the project must end in less than 10 months. The client can wrongly assume that it is more likely for us to be on the upper end of the provided range, which is 12 months, and they can decide not to do the project with us. We were technically correct but didn’t provide the needed information.

Boundary. Setting boundaries is an important technique for simplifying the reality and for staying safe. It is the emanation of responsibility. When we stay within reasonable boundaries, the people we work with get the healthy mes- sage that we are taking measures for our own safety, and as a result they tend to see us as more trustworthy. However, let’s quickly consider what a reason- able boundary is and how does the nature of the work change the meaning of reasonable.

People often say “Don’t drive beyond your headlights.” This is as valid in soft- ware project context as anywhere else. When driving a car, it simply means to drive with a speed which allows you to stop on time when something enters the illuminated area ahead of you. When controlling a project, it simply means to only commit to what you have real information about.

One of the difficult things when communicating ideas is to make sure that other people understand accurately what we have in mind. For example, when we say that the estimates show it will take around 10 months to com- plete the project, it is likely that people understand this as “The project will take 10 months to complete.” But what we said is that an estimate we made is 10 months, not the (actual) length of the project.

Let’s see how setting a boundary can expose the important limits in our statements and help with this problem. We may say this instead: “We only have looked at the first two modules with enough detail to speculate on effort cost and duration. Based on what we have estimated, and on all the assumptions we made, we think it will take us 1.5 months to complete these two modules. We have identified a few risks as well. If you want us to discuss the assumptions or the identified risks, it can help us all stay more aligned through the next 2 months. If the projection for these two modules turns out correct, we will be comfortable forecasting the whole project at 16 to 18 months.”

The boundaries we set in this statement are

  • Only part of the system has been assessed.

  • There are assumptions, so we only feel safe within them being true.

  • The overall estimate is based on the smaller estimate being true.

  • There are also some risks.

Now, it’s true that the statement is not Twitter friendly. 3 But it sets boundar- ies within a relatively concise articulation, and these boundaries make it more likely that the client’s understanding of what we said is closer to what we meant. A listener might need some extra time for processing it, and we might need to furnish help, but this extra time is in the order of minutes. If we spare the few minutes here and try to be short, we risk people working with incor- rect understanding for months.

This is important because when we allow the discrepancies in people’s under- standings to accumulate for long periods, it drains their trust and will eventu- ally exhaust it—people become convinced that there is no chance for common understanding. When this happens toward the end of a long and complex project, there might not be enough willpower left for discussing issues ratio- nally and making collaborative decisions that work for everyone. Instead, it is likely that people start blaming each other. Someone will invariably say “But you said 12 months! We are now only 2 weeks from that!”—estimation and forecasting have turned into tools for assigning blame and controlling people, not tools for controlling projects.

Let’s now see how the meaning of reasonable boundary can change based on the essence of the work. Consider the driving through the night analogy again. While we are driving the vehicle, it is reasonable to only stay within the headlights. It might be even more reasonable to stay within half of what the headlights cover. But let’s imagine that we stop driving and take a short break on the side of the road. There is nothing wrong with envisioning how long it will take us to the next little town, so we can find a restaurant to eat, or how long it will take to cross a continent, if that’s what the trip is about. When the nature of our work is to envision the future, it becomes unproduc- tive to maintain the same boundaries that make sense when we work on the immediate tasks propelling us toward that same vision.

When the future is unknown, we can still maintain enough limiting condi- tions—for example, we can say, “Provided we maintain the same pace, we will deliver the first phase of the project in 6 months, so 9 months in total. Based on the high-level specifications, it seems the second phase is similar in size, and it is likely to take a similar amount of time, but this is a speculation which I’m not comfortable with at the moment.”

Many people these days take pride in emulating Steve Jobs and emit ridiculously succinct messages (in emails or otherwise), only to then have other people perform inordinate amount of juggling and mental trickery before finally arriving at the “correct” rendition of the intent in the commanding message. We need to be careful when pretending to be Steve Jobs!

We can share our fears and not push through by force and commitment only. Stated fear is a type of boundary, and we communicate that we are not willing to venture too far beyond it. This way we stake a claim into the unknown and still maintain boundaries that make sense to us. Opening up with our fears takes courage. And we show others that we are both brave and smart. It is important that we are brave at work, and it is also important to stay respon- sible. As we get more data, we can sharpen the boundaries and engage with commitments without fear.

Void. Void is the construct signifying the absence of something. The impor- tance of this construct is that it allows us to not have to invent information about something that is simply not there.

When we can intelligently deal with uncomfortable situations, we are creating trust. It is much more responsible to acknowledge an (ideally temporary) inability to provide information than to supply fake data masquerading as information. Whether we work for other people or we risk our own money, being responsible is the behavior which creates and builds trust the most. Being irresponsible can destroy trust quicker than any other misstep, even when it doesn’t cause material loss.

Business people can handle void fairly well if they know when information will be available. They can also handle cost associated with obtaining information sooner. The cost might be in money or in increased risk. This allows us to say: “I cannot provide meaningful information for the target date at the moment, but if we start now, with the team we considered, I can provide an outlook with 90% certainty in 2 months, and with 70% certainty in 4 weeks.”

Business people are capable of managing this type of situation well, and pro- vided we can supply the additional information as promised, void is more meaningful than something that we only wish to be true.

Probability. This leads us to the next construct—probability. Because it is such a central notion in estimation and forecasting, it has its own section in the next chapter. But let’s quickly sketch it here as a tool for simplifying the reality and talk more about its other properties later.

Probability is in a way similar to a range. With a range we guarantee the value is within the upper and lower limits. With a probability we avoid providing that guarantee, but provide a measure of how likely it is that the actual value matches some target instead.

When it comes to software estimations, probabilities do translate to a range almost directly. For example, if I say, “I’m 80% certain the project will end 10 months from now,” this can be translated like “The project will end between 10 and 12 months from now.” Where if I say, “I’m 90% certain the project will end 10 months from now,” then this can be interpreted as “The project will end between 10 and 11 months from now.”

It is interesting to note that when we make software projections, we talk about things taking longer than expected and not shorter—“I’m 80% certain that the project will end 10 months from now” rarely means the project might turn out to be 8 months. There is an implied “at least” in front of the number of months—“I’m 80% certain that the project will end at least 10 months from now.”

Summary

Software projects are complicated. However, there are communication tools we can use to simplify things considerably and still have a correct understand- ing of the relevant issues. These tools are common structures that make it easier for us to comprehend problems, to find and share options, and make decisions.

People have different demands for information and different tolerance levels to simplification. We need to learn how to use these simplification tools in ways that fit organically with everyone on the project—clients, developers, and managers. If we can help others feel more comfortable, then we can secure a better environment for effective collaboration.

Things need to stay as simple as possible, especially when it comes to estima- tion and forecasting. But sometimes we need to think beyond simplicity in order to capture it truly. We are discussing a few slightly more complex phe- nomena in the next chapter, and this gets us ready to start on the core of this book.

Statistics and Probabilities

In this chapter we touch on statistics and probabilities. We will look at a few interesting applications of statistics and will focus on how they affect decision making, because the main purpose of intelligent forecasting is to facilitate decision making and project control.

Probability

What is probability? What does it mean to you? For example, what does it mean if I say that you have 80% chance of making $100 profit when you invest $100?

It doesn’t mean much as a number on its own. It doesn’t tell us whether you will win $100 or not. It only starts meaning something when we put it in context of other things. For example, are you willing to take on the 20% probability that you lose $100? Do you only have $100 available? Are you only allowed to bet one time, two times, or more? Is it your goal to win the extra $100 in the first place? The answers to these questions provide real meaning to the probability number.

Probability is a number that helps us decide if we want to try something with the intent of obtaining a certain outcome. If we are not interested in the specific outcome, the probability number is of only superficial interest. But if we do care about the outcome, then this number starts having a more material meaning.

When we talk about a singular event, probability represents a binary reality— something either happens or it doesn’t happen. The probability number informs us how likely are we to win or lose. If we are willing to take the risk of losing, we might proceed. If the risk is too high, or the potential prize too insignificant, we might choose to not proceed. But regardless of the likelihood, if we decide to proceed, we still either win or lose.

process groups

Figure 3-1. P=0.2 means there is 20% probability for an outcome. With a single event, there will be only one result, and although the shaded area result is more likely, there is no guarantee there will be a result corresponding to the shaded area.

When we work with a stream of events, we observe something else—the probability number starts describing how frequently the desired outcome occurs. It is now almost guaranteed that the desired outcome will happen—we just don’t know how many times exactly. As the number of events gets bigger, the guarantee becomes stronger, and so does the likelihood of the actual number of successful outcomes being closer to the probability number.

process groups

Figure 3-2. At 5 events the actual number of gray dots might not represent 80% of the total. At 500 events the actual number of gray dots is very close to 80% of the total.

When we apply a probability number on multiple independent events, things line up to what is known as normal distribution curve. It is a line that describes the likelihood of things happening as we move along a range of probable states.

process groups

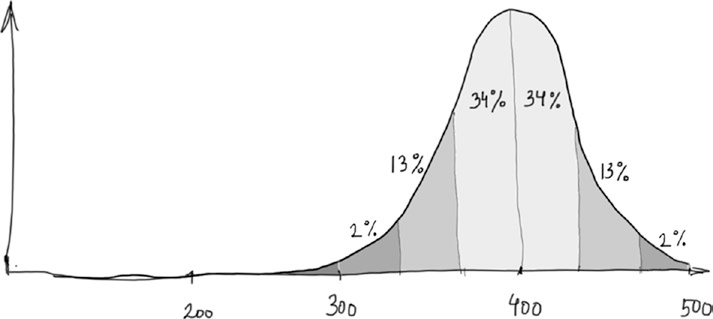
Figure 3-3. If we ran 1000 independent experiments with P=0.8 for an outcome, and with 500 samples in each experiment, and if we measure the actual number of desired outcomes per experiment, we would have a result similar to this graph. In 68% of the cases, the number of desired outcomes will be between 370 and 430, and in 95% the number will be between 330 and 470.

In a normal distribution, the most likely outcome is called “mode” (400 is the mode in Figure 3-3). Almost all, 99.6%, of the possible outcomes fall within the ±3 standard deviations from the mode. A standard deviation is a span on the dimension of interest, which span helps statisticians discuss the probability distribution easier. Each shaded area in Figure 3-3 is one standard deviation wide. Approximately 70% of all outcomes fall within ±1 standard deviation from the mode, and approximately 95% fall within ±2 standard deviations from the mode. These numbers might seem contrived, but it turns out they apply over a very large set of natural phenomena.

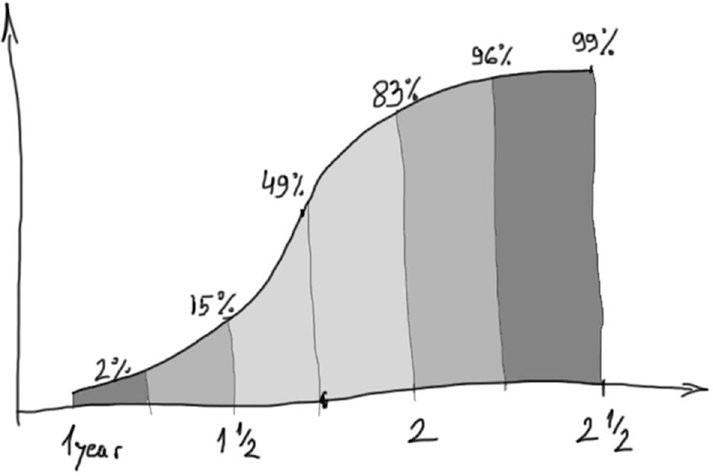
Let’s say we have a team of two developers and have estimated (guessed) a project at 1.5 years. Let’s say we have information to think that the absolute best we can do is 1 year, and based on other assumptions, we think that 2.5 years is the worst we can do. We can build a cumulative probability curve (Figure 3-4) describing how likely the estimates seem based on what we know at this moment.

process groups

Figure 3-4. Cumulative distribution curve showing that the original 1.5-year estimate is not as likely as we might have thought when making it

The cumulative distribution curve indicates with about 85% probability that the project will be less than 2 years, and with only 15% that it will be less than the estimate of 1.5 years. Even with a grossly oversimplified model like this, we can start making some crude decisions and we can improve communications on the project.

Getting Accurate Information Based on Imprecise Inputs

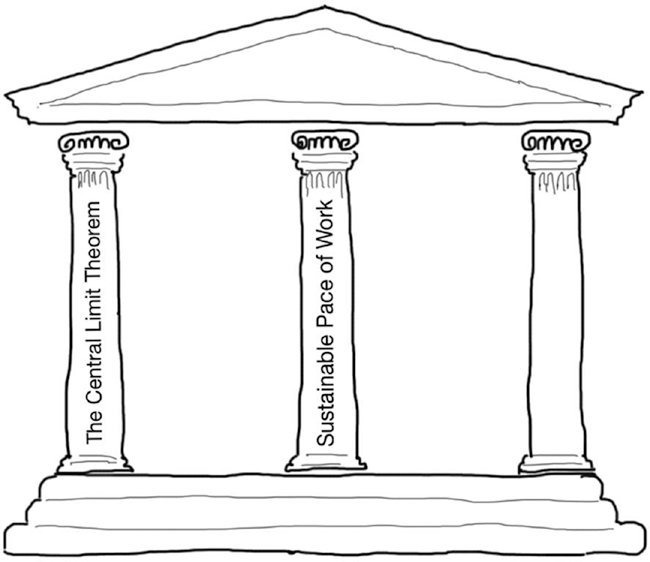
The Central Limit Theorem tells us that the sum of many random and independent variables is approximately normally distributed regardless of the specific distributions of the variables. This is of great significance and is a powerful tool we can use for project planning, because projects are such a sum of large number of variables. True, they are not always independent, and they are not always completely random, but it is a good enough approximation that we can use to bypass hefty sets of complexities.

With the help of this theorem, we can view the whole project as a single (sum total) variable, and we can analyze the probability of this variable being within a certain range through the help of a normal distribution curve. Something we’ve been intuitively doing before, but not taking it to its logical conclusion.

What this means for us, as software developers and project managers, is that even if we botch the accuracy on every individual estimate, we can still have confidence that the sum total remains within the same normal distribution. Figure 3-5 shows that we can reason about the distribution of the sum total and make intelligent speculations for the “total accuracy” without having to worry about the accuracy of each of its elements.

process groups

Figure 3-5. A sum total normal distribution curve comprised of multiple variables’ distributions

ACCURATE ESTIMATION! WHAT IS THIS?

We should mention here that the idea of an accurate software estimate is somewhat of a misnomer. This is because the thing we are building does not exist yet. If we were to estimate the length of a ship, both the real length and the estimated value exist at the same moment in time. They can be compared and we can determine the estimation accuracy. However, if we are to estimate the effort for building something, it is only the estimation value that exists at that moment—the actual effort for building it does not exist yet and cannot be measured. Thus we don’t have a reference for establishing the accuracy of our estimate.

It might be better to say “adequate estimate.” However, I’ll still use the notion of accuracy since it is more crisp and everyone understands what we are talking about—namely, whether the effort that we eventually expand ends up matching our original guess. But we need to recognize that there is a big time span between these two numbers being available, and we normally don’t just sit and wait to see if they end up similar, but we actively apply controls to drive the project where we want it to go.

What is now left, in order to feel confident in the actual values represented by the distribution model, is finding out how much the normal distribution for the estimated effort is offset from the “real” effort. And for this, there is nothing else we can do except take measurements from reality. We can have a sufficient measurement sample within a few weekly iterations, or within 1–2 months’ worth of work. Provided we work on a decently sized project, this leaves us with plenty of time to make decisions and take actions based on the information we get.

With this knowledge we can provide accurate information for the total based on multiple inputs, each of which is inaccurate. Sometimes clients and managers expect that we nail down each software module we work on and that we expand exactly the amount of effort we estimated.

We could be working on the second module, out of a 20-module system, and it might have been estimated at 5 calendar weeks. It is now taking 7 weeks. Clients or managers might escalate the situation disproportionately. When this happens we need to remind them that we are only forecasting and managing the project, and that we do not have bandwidth (or a reason) to control the execution of each discrete module with the same precision.

Control, Lack of Control, and Precision

The statistical controls we are discussing here can be rather loose when there is a low number of sample variables on which to model the distribution. For example, if we have only delivered 3 or 4 chunks 1 from a system, and we are trying to use the available information to forecast the remaining 97 chunks, then we cannot apply statistical controls yet. Our decisions will be poorly informed. We need to work with a sample of at least 20–30 variables, and ideally more than 50, before statistical principles start to work reliably for us.

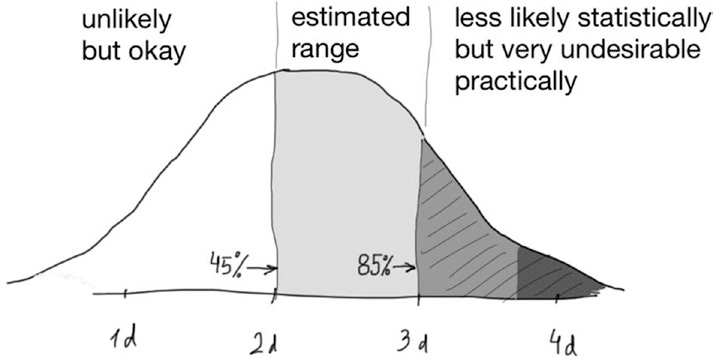
What this means in practice is that we cannot approach the management of a project purely as a statistical problem. This is because usually there are not enough chunks to get to a good sample quick enough, and we need to start making decisions before we have a solid statistical model. This translates to the team and the project manager still having to work out problems quickly and persistently, just like they would regardless of any project management techniques. For example (See Figure 3-6), if a set of functionality was estimated between 2 and 3 days and we sense trouble on day 2, we need to act 2 and not merely observe and record (for the sake of statistics) how long the job will take. We will talk about sample size later, but when the whole project scope is represented by 150–200 chunks, and we need a reasonably good forecast by the first few iterations, we need to stay firmly on the project controls from day 1.

A chunk can be of any size and is not the same as a user story or a functional specifica- tion. A chunk represents a set of functionality which we have decided to estimate together. We will talk about resolution and splitting the whole scope in chunks later. For a large project, a single chunk can represent 3–4 weeks’ worth of work for a single person or a programming pair, and for smaller projects a chunk can comprise 4–5 days’ worth of work. To “act” here means to make it easier for developers to carry out the implementation work. Acting does not mean to pressure developers into speeding up—this is a useless activity from the point of view this book is taking. A scrum master or project manager can help by getting business people to prioritize the work in advance, or by working with PO (Product Owner) or BA (Business Analyst) to simplify existing specifications and require- ments, or by getting coffee and cookies, and so on. A developer can help by seeking help or offering help, providing quick feedback, and so on. This is what is meant by “to act.” Everyone should be working together to accomplish activities which help the team move forward expeditiously.

process groups

Figure 3-6. We do not want to casually venture outside of the estimation range, although statistically the event is representative of the same distribution curve

If we keep too loose control over the execution of the work, and we approach the problem as a purely statistical observation, then we can go through some large deviations from the “plan.” This will make the people who are following the progress of the project uncomfortable. When people are not comfortable, it is difficult for them to trust us, and valuable energy might get expanded toward unnecessary problem solving. And even if the forecast works out well by the final stages of the project, we would have still missed the point, since it was to create trust during the project, not to prove that a conceptual model has been correct as the project is finishing.

On the other hand, if we have a knee jerk reaction on every deviation from estimates, this does not contribute to project control either. For example, if a task that was estimated at 2 days is taking a day longer (150% already), but developers know exactly why, then we should not start bothering other people with escalations or requests for help. This would only make everyone more uneasy than if we were too loose on the controls.

Overreacting can be not only useless but outright dangerous. It may destabilize the project’s ecosystem to the point where things get out of the Central Limit Theorem’s domain. If we alienate developers, and make people unwilling to invest their full selves into the project, we might have introduced instability that cannot work itself out by mere statistics.

The Central Limit Theorem tightens as we reach farther. The larger the project, the more useful the Central Limit Theorem becomes for practical application. This is somewhat counterintuitive but extremely important— forecasting and controlling for a long project is more manageable than for a small project. (However, guessing is more manageable for a small project.) We still need to work out the immediate problems even on longer projects, and there will be more of those problems because of the longer timeline. But when applying project controls based on surveying longer-term goals, we can make fine input adjustments with larger impact and stay ahead of the (probable) events.

Figure 3-7 shows that at the same desired burn-up rate, and the same deviation at month 2, we need a much smaller rate adjustment on a 9-month-long project in order to compensate for the lateness, compared to the adjustment we need on a 4-month project.

process groups

Figure 3-7. Corrective adjustment on shorter vs. longer project

Summary

Many people in the software industry, especially people working with agile software development methods, have given up on estimation and they feel it is useless. They feel it cannot be done with accuracy, or that it doesn’t make a difference how precise you try to be... at the end the project is never on time. The value of a forecast for facilitating project control is being lost because of an irrelevant focus on estimation accuracy. The unwillingness of people to commit to an objective in the face of uncertainty is a direct cause of this confusion of the main purpose of a forecast. This is a mistake that ends up costing companies multimillion dollar opportunities and ruining the chances for good relationships.

Instead of forcing unneeded expectation on the precision of the initial estimation, we need to learn how to harness imprecisions and proven statistical principles, along with the capabilities and skill of our teams, in order to gain valuable business advantage. By doing this we can commit to success early, based on minimal set of data. We are not committing to a number, rather we are committing to working out an adequate and timely solution within an agreed-upon project envelope. By inverting the order of events, and agreeing to commit before we have a precise outlook, we open the possibility for a meaningful forecast, which in turn gives us the required leverage over powerful project control tools—including negotiating scope, reinventing business ideas, adjusting team composition in timely manner, and even reframing the project itself (with everyone on board).

Forecasting Mechanics

Let’s get to it! How do we put all this in practice and work out the project envelope? What exactly are the things we do to apply intelligent project control? How do we provide a clear indication of progress, maintain the required team workload throughout the project, and allow business people and the delivery team ample time for scope considerations and decisions? How can we do something today that helps us aim at a 2-week time window 12 months in the future? The method for intelligent forecasting is a practical application of the scientific method and can be broken down in the following steps:

  1. Define a scale (ballpark approximation)—Scale can be as wide as the expected project length or it can be some portion of it. It is not to be confused with an overall estimate of the project. It might be roughly similar in length, but the actual project estimate is produced later.

  2. Define a resolution—Resolution represents the number of chunks in which we need to break up work in order to gain a sufficient statistical grip. Higher resolution provides an increased certainty, but it also costs progressively more to sustain.

  3. Initial estimation and sizing—Based on the desired resolution and other factors, we need to design ranges for estimating effort. Once we go through the initial estimation, we can size the project and take a first guess at whether the team has enough capacity.

  4. Adjust for calendar time—It is crucial to convert the effort estimates into calendar time. This is because the actual completion data we collect in the next step is based on calendar time. Once we convert effort estimation into calendar times, we can also speculate about optimistic and pessimistic completion dates for the project.

  5. Collect data—Estimation data is only one input for the forecast. Tracking the actual implementation times and observing other contextual factors provide another set of input information. The relationship between estimates and actual completion times becomes the basis for adjustments and predictive accuracy.

  6. Identify trends and scenarios—Once we have collected enough data, we can start analyzing, making projections, and evaluating different scenarios.

process groups

Figure 4-1. Achart depicting project burn-up along with the team’s available thrust

Figure 4-1 shows an example output of this process. This chart captures the evolution of the project delivery, and when used in the early months of a project can facilitate the decision making needed for applying confident project management.

We will discuss and reveal the elements of this and a few other charts throughout the remainder of the book. In this chapter we focus on the mechanics of obtaining a meaningful forecast—diagramming, defining suitable chart scale, partitioning the scope to facilitate estimation, sizing the project, collecting data, and producing a plot on the chart. In the next chapter, we will analyze various chart indications and discuss the project controls that we can apply.

The discussion in this chapter moves much closer to the practical application of the estimation method. For those readers who enjoy spreadsheet formulas and charts, the sample spreadsheets and diagrams in Appendix B at the end of the book and at www.apress.com/9781484250242 might facilitate your familiarization with the details of the method further.

Determining the Chart Area

The scale/ballpark. The first thing to do when building a forecasting model is to prepare the “charting surface” by figuring out the rough scale of the effort. What we come up with at this point is not an estimate. It is only an idea of the scale at which we want to be working. Is it a few months, a year, or more? This choice is very important for the utility of the resulting forecast. If the scale is too large, we might not be able to pick up on important project events, and if the scale is too small, we might not be able to anticipate far enough.

In Figure 4-2 we can see two different approaches for selecting a forecast chart scale. An approximately 1:1 ratio scale is selected for the project with an expected length of 11 months on the left and a 1:3 scale for the 24-month project on the right.

process groups

Figure 4-2. Selecting an adequate forecasting scale

It is important not to confuse the scale with an estimate or a forecast. At this point we are only figuring out a number (time period) which will help us build a meaningful chart—one that will help us with its indications. The selection is not unlike choosing the right scale for a driving map, where a city map will have a large scale, a country map a medium scale, and a continent map a small scale.

Resolution. I define resolution as the number of chunks we want to work with for a given scale. You might have seen it elsewhere as sample size. Higher resolution provides for a more controlled application of the statistical principles on which this method relies. However, having too high of a resolution adds more noise than valuable information, and it also costs more than the utility it brings. Having too low of a resolution makes the forecast loose and less useful for promoting trust. We need to find pragmatic resolution and work within this “normal” range.

Statistics starts being applicable once there are at least 30 samples. At this resolution the confidence levels from statistical analysis are relatively low. At a resolution of 60–70, we can get to statistical error of 15%. At 200–300 variables, the expected error goes down to about 5%. At a set of 2000 variables, the statistical error can drop to less than 3%.

In software development, aiming for early forecast precision of 5% is naive at best and unethical if done by people with experience. If the project sponsors are calculating their business opportunities at precision levels of 5%, then something is seriously wrong. Early confidence of between 5% and 10% is extremely challenging in software development, and a confidence between 10% and 15% should be sufficient for anyone with a practical business need. Business people should be able to maneuver within this range of uncertainty and make useful business decisions without putting undue administrative stress on a project.

CONFIDENCE LEVELS

You might have seen the “Cone of Uncertainty” diagram that depicts how confidence levels get progressively better as a waterfall project moves along the phases of initial concept, approved product definition, requirements complete, user interface design complete, detailed specification design complete, and so on. You may have noticed that the estimation error at the start of development phase is 10–15%.

The difference here is that not all “15%” are equal. The 10–15% we are discussing in this book are based on data and statistics. The 10–15% people mentioned in “traditional” estimation approaches are based on a belief, such as “I believe that the accuracy of this estimate is 10%. It has to be, we spent a lot of time on it and estimated based on very detailed specifications. I mean, it has to be 10% or better. Worst case scenario it’s 15%, but not more.”

Therefore, a useful and pragmatic resolution level is around 100 samples on the lower end, and 250–300 on the higher end. Keep in mind that we are not leaving the fate of a project in the hands of chance and statistics alone. We are applying active project control based on multiple inputs, with the forecast being only one of them.

Imagine we are one and a half months into a year-long project (i.e., there are a little more than 10 months left). The following statements ought to be sufficient for an intelligent follow-up conversations and decision making:

  • “We are 80% confident that with the current team setup we need 2 months longer than the current plan.”

  • “We are 80% confident that we need 3 more people with compatible skills to join the team within the next 1 month if we are to make the original deadline.”

  • “We are 80% confident that unless we cut functionality in these three specific modules, we cannot make the timeline with the current setup of the team.”

If people are able to start this type of conversations less than 2 months into a 1-year-long project, and their confidence levels are (meaningful) 80% or 90%, then this is all that is needed—a trustworthy method for pulling problem solving early into the project. When we pull problems early, the proposed solutions have an improved chance of positively affecting the outcome. And we might even have time for additional solutioning, should the selected approaches prove ineffective within a reasonable timeframe.

PLAN-DO-CHECK-ACT

The essence of project control is observe, think, act, observe (Figure 4-3). It is a variation of the PDCA cycle (Plan-Do-Check-Act) of many continuous processes. The essence of project management, and its associated practices, is to secure the environment where this type of control is feasible.

process groups

Figure 4-3. PDCA model for project control and the accompanying project management practices

Sizing the Project

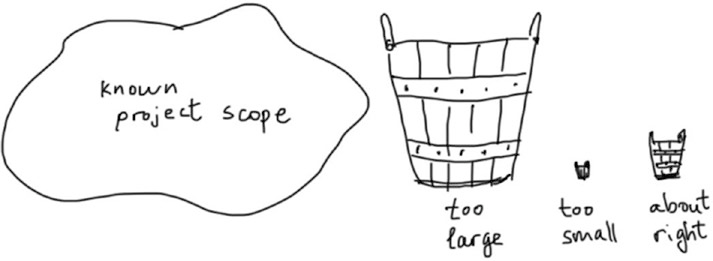
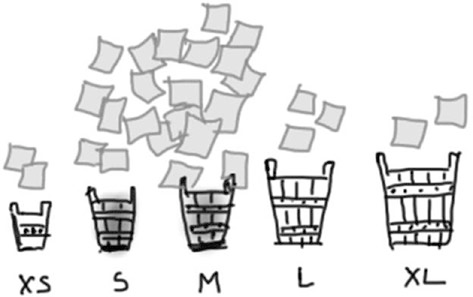
Estimation ranges. We need to break down the scope into desired resolution. Whether we have a large system specification document or we are just starting with identifying a story map, we need to comprehend the known project scope. Splitting the known scope into the necessary number of chunks to support the resolution is relatively straightforward. In order to facilitate this process, it’s worth identifying meaningfully sized buckets (see Figure 4-4) that developers can use for labeling the chunks of work.

The proposed software solution needs to be captured in the form of a specification. It is irrelevant whether we’ve done this through a specification document, a story map, or a flat backlog of stories and epics. The important thing is that some areas of the solution are described in enough detail to be broken down in meaningful chunks.

For example, if we have a specification of 100 pages and the level of detail is relatively consistent throughout the document, then we can assume that half a page will contain enough material so that we can split the app in 200 chunks. Similarly, if we have a story map, we can figure out a way to chunk it even when some of the stories are not detailed yet.

process groups

Figure 4-4. Establishing the right size of bucket is important for supporting a workable resolution

This is a very mechanistic activity, and there will be instances where half page captures way too much work or too little. However, once we look at a few of the chunks, we can start getting a sense of what is an estimation range that can support them. For example, we might be working on a system where the first few chunks all feel between 1 and 3 weeks’ worth of effort. We can then design two ranges from 1 to 1.5 weeks and from 1.2 to 2.5 weeks and proceed with fitting the rest of the chunks using these two ranges. When we stumble on an area of the system with insufficient detail, we can define large and extra- large ranges to support whatever chunks we can carve out.

T-shirt sizing is ideal for this and we can choose to have five ranges when there is more variation in detail (XS, S, M, L, XL), or only three ranges (S, M, L) when the detail is more consistent (see Figure 4-5).

process groups

Figure 4-5. Some of the buckets (S, M) support the desired resolution better, but we should provide smaller and larger buckets just in case some of the chunks are not the “ideal” size

The estimation ranges are in “days’ worth of effort” and not calendar time. With an average chunk size of between 1 and 2.5 weeks (supporting the desired resolution), we might have these ranges:

XS = less than 5 days (less than 1 week)

S = 4 to 7 days (0.8 weeks to 1.4 weeks)

M = 6 to 12 days (1.2 weeks to 2.4 weeks)

L= 10 to 19 days (2 weeks to 3.8 weeks)

XL = 16 to 30 days (3.2 to 6 weeks)

On a smaller project, we might have smaller ranges supporting the same resolution:

XS = less than 0.8 days

S = 0.5 to 1.5 days

M = 1.3 to 2.5 days

L = 1.8 to 4 days

XL = 3.5 to 6 days

I try to gauge it so that the S and M ranges are around or slightly smaller than the average chunk size. This way, when most chunks fall within these two ranges, we should end up with a total number of chunks that is around or slightly larger than the target resolution.

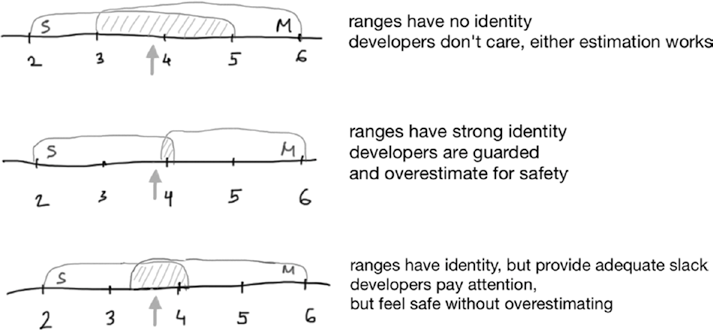
Establishing the initial estimation ranges is best done if the ranges are slightly overlapping and progressively growing (see Figure 4-6). A tighter range selection, without excessive overlap, creates a slight pressure for developers so they don’t accidentally stop paying attention when throwing chunks into the buckets. Too little or no overlap generates the wrong type of pressure— chunks which estimate seems close to the upper limit of a range will routinely be labeled as belonging to the next larger range for safety. I like the end limits oscillating around the Fibonacci numbers and the ranges overlapping at about 20–30% of the smaller range. The other thing to look for is to make the largest range not much larger than two times the chunk size supporting the resolution. Having five ranges is preferred because it lets the developers feel unobstructed, and it makes for a quicker exercise. But three ranges will work too. The overlap is important because it puts developers at ease. They see right away that a chunk can go one way or another, and they appreciate this flexibility since it properly reflects their real experiences with estimation. They are willing to not overestimate, because they realize the next chunk might go the other way too.

process groups

Figure 4-6. The gray arrow indicates what is the “gut feel” of developers—a little more than 3 1⁄2 but less than 4. Ranges with no identity are less useful in subsequent forecasting. Ranges with strong identity trigger developers to overestimate. Developers are inclined to label the story as M more often in the second example than in the third example. (The numbers here might represent days’ worth of work, or weeks’ worth of work.)

With properly sized ranges, people get into collaborative mode much sooner, and estimates for large sets of functionality get done quickly. It almost becomes a game. In contrast, when the ranges are not overlapping, or if developers are forced to estimate with “precision” (in exact hours, and not in ranges), they are much more cautious what estimate to assign, and this leads to routine overestimation, frustration, and lengthy argumentations, which cost significant time, bring no value, and ruin the relationships within the team.

Estimating the work. Now that we have the estimation ranges defined, we need to break the known scope of work into pieces and start estimating. We estimate in days’ worth of effort per single track, 1 that is, if the developers had the day exclusively for delivering working software—programming, designing, and testing. If we observe that most chunks get in the S and M buckets, then we can just keep going. Some pieces will end up being XS, and some will end up L or even XL, but the bulk of the pieces should be in the S and M ranges (see Figure 4-7).

process groups

Figure 4-7. Aim to have chunks split in a way that makes them suitable for the S and M buckets. It is okay to have a few spill over into the other buckets. (Do you notice the normal distribution?)

If too many pieces end up in the L and XL buckets (and if it looks like we won’t get enough chunks to get to the desired resolution), then we need to split those chunks further so we get them down to S or M. If most of the pieces get estimated as XS, then we need to zoom out and look at less detail. This is where a good business analyst or a product owner can provide just enough detail so the developers can split or aggregate the work. And a scrum master or project manager can keep the process moving quickly, helping people zoom in or out as needed so they don’t get stuck on irrelevant debates. The one thing we don’t want to do at this step of the process is to burden developers with a request for precision estimates just because there is a detailed specification (see Figure 4-8). People might argue that a developer should be able to gauge the effort with precision if the functionality is described with great detail. But it doesn’t work that way in software development. The specification detail doesn’t provide developers much help for estimating a piece of work with higher accuracy. However, detailed specification helps for breaking the work into smaller chunks. The smaller chunks can then be estimated at a higher resolution. If we want better accuracy for the final forecast, we need to aim for a higher resolution, and not for higher accuracy of individual estimates. The objective of the T-shirt sizing exercise is to get as many chunks as we need estimated and get it over with quickly.

process groups

Figure 4-8. Do not ask developers to provide high precision estimates for intricate functionality based on detailed specification. Ask them to provide high resolution estimates even if each individual estimate is of lower accuracy.

Estimating at a very high resolution is wasteful. We need to pay the cost of business analysts and developers looking at too many details and scrum masters or project managers having to track too many pieces of data. It can slightly speed up the forecasting when we start collecting data, and it can provide a (false) sense of certainty, but it costs more than the value it contributes. We should work at a resolution that makes sense and be careful every time we lead people into thinking we are working at too fine of a precision. Most likely we cannot achieve that precision for the final forecast, 2 and no one needs it—people only need an adequate guidance toward the objective.

I worked with a new CTO some time ago and he announced that we were going to start estimating and delivering all projects with a precision of +/- 1 day. He was reasoning that if the airlines are able to schedule transcontinental flights with precision of minutes, we should be able to deliver 3–4-month-long projects with a precision of 1 day. The frequency of deployment to production was once every three weeks because of dependencies with marketing campaigns and with other departments. Even if we were able to forecast within 1 day of the actual delivery, it would bring small practical value.

If the developers cannot engage in the kind of estimates discussed earlier, but the product owner or business analyst believes there is sufficient specification detail, we as scrum masters or project managers need to make sure developers understand that the result of this estimation is only one of the inputs for the forecast. It is not a binding contract or a final commitment. Their responsibility is to make a fair attempt at guessing the amount of work needed for each chunk and to be consistent, so that if two pieces of work seem equal in size, they get estimated approximately the same. Developers should definitely not throw random estimates, as this will sabotage the exercise and possibly the project.

First stab at planning. If you haven’t cringed at some of the simplifications so far, you might get a cringe now. However, before we go through this, let’s state one more time that the purpose of estimation and early planning is to enable intelligent project control through the rest of the project. The purpose is not to produce an accurate and precise guess at the beginning of the project.

Suppose we want to finish the project in 12 months and we have estimated all the work as if a pair of programmers will be working on it. Let’s say that when we sum all the estimations, we get 3 years’ worth of effort.

process groups

Figure 4-9. In a single track, the whole project is delivered one bucket at a time

If we only had these two developers (see Figure 4-9), then there is obviously no way to complete the project in 1 year. There are certainly things we can discuss with business people and choose a meaningful 1-year goal. But if we want to finish the whole project in 1 year, then we need a larger team. The mechanistic “mythical man-month” approach is to simply figure out how many tracks are needed to complete the project (see Figure 4-10).

process groups

Figure 4-10. In a multitrack, the project is delivered a few buckets at a time. Thus the work gets complete quicker

However, there are software development laws 3 that prohibit this rectangular approach. Gall’s Law in particular says that we cannot start with a complex team. In practice this means that we should start with a single track effort until the solution and the team has matured enough to sustain two tracks. After some period the team and the solution might graduate to three, four, or more simultaneous tracks.

The problem becomes to allow ample time for team growth while supporting the completion of the project within the desired timeframe. The large things to consider are people’s skill, team’s autonomy for technical decisions, team compatibility (self-selection?), collocation or lack of, and effort time vs. calendar time.

First pass project projection. We just stated that the estimation based on the initial XS, S, M, L, and XL ranges is not contractual—there is no immediate commitment. But business people often need an early idea for the expected size of the effort before they commence. What can we do? We can produce a range. In this case we can build a range from an optimistic and pessimistic prognosis for the required effort.

You cannot undercommunicate the fact that this will only be a guess. People should treat it that way. Make sure that if any of the numbers and dates gets picked as project targets, people realize these are the aspirational targets we want or hope to meet, not the targets we have promised we will meet.

RELATIVE ESTIMATION

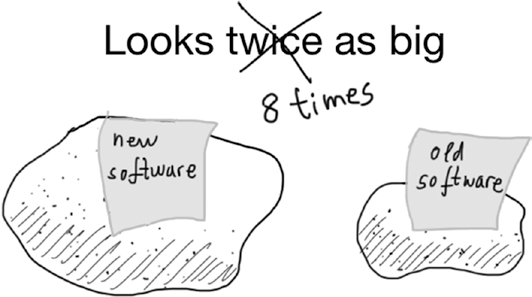
Beware of the relative estimation technique that is discussed in many books on agile software development. It looks something like Figure 4-11, and the accompanying description usually says that a “stone” that looks twice the size of another “stone” is twice as big. However, this is not true. A stone that looks twice as big as another stone will be eight times larger, because a stone is three dimensional, and two raised to the third power is eight (2 3 = 8). In software, the work is often multidimensional and the effect of this visual “illusion” can be even larger. (Some of the typical dimensions are business rules, software architecture and design, database access, performance, security, usability, accessibility, visual design, automation and documentation, training.)

process groups

Figure 4-11. Relative estimation

When initially estimating the chunks of work for the whole project, we would do better if we looked at each one separately and give it our best shot of placing it in the right bucket, without comparing it too much with chunks we have already estimated. This way we don’t inadvertently compound the estimation “errors.”

The technique of relative sizing is adequate when applied on an iteration level estimation in “story points,” because at that time developers are intimately familiar with the context. Story points are not useful for initial project estimation and forecasting, but they serve a different and very important role. We will talk about it later in this chapter.

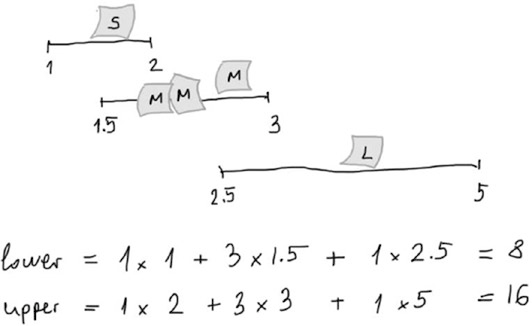
We can add up all the lower limits of the chunks’ ranges, and all the upper limits. This way we can come up with two numbers, each unlikely, but encompassing the likely scenarios (see Figure 4-12). Again, a range is a useful simplification when we are trying to work with complex problems without the benefit of having experienced all the complexities yet.

process groups

Figure 4-12. We can calculate the lower and upper estimation limits for the whole project by summing the lower and upper range limits of all pieces. The numbers here can be days’, weeks’, or months’ worth of effort.

Keep in mind that this is the implementation effort. For duration range we need to adjust for calendar time.

Adjusting for calendar time. It is wise to not confuse effort estimates with calendar time. Such confusion is a naive mistake, but sometimes people do it when rushed to produce a convenient answer. When we ask developers whether something takes 2–3 days, we are really asking whether it is 2–3 days of implementation work (a.k.a. programming), not whether it is 2–3 days on the calendar. If developers need to attend meetings for 3–4 hours a day, the effective time for implementation work becomes 2 hours per day, and a piece of work estimated at 2–3 days might take 8–12 days on the calendar, that is, 2–3 weeks.

One way to translate between effort and calendar time is to add certain buffers that make sense in the particular situation. Meeting time is only one of the things we need to consider when converting effort estimates to calendar time. On a longer project, people need to take vacation, which might be up to 10% of the calendar time. We can apply this buffer without asking people for actual vacation plans. 4 There are many other activities that do not directly contribute to software. (There is a longer discussion on this type of safety buffers in the “Navigating Issues” section of Chapter 6.) Multiplying the optimistic and pessimistic end of the effort range by 1.5 might be an honest thing to do when converting to calendar time as long as we can explain what goes into the extra 0.5 (50%) that we are factoring in. We can also produce a “realistic” estimate by using PERT calculation (see Figure 4-13), or by locating a point reasonably spaced between the optimistic and pessimistic limits.

process groups

Figure 4-13. PERT formula for realistic estimate is E = (O + 4xM + P)/6, where O is optimistic, M is most likely, and P is a pessimistic prognosis. (The effort-to-calendar conversion ratio is 1.5.)

Again, tell people this is only where we are aiming, not where we are going. At least not yet.

Fine-tuning. The problem with coarse breakdown is that we need a longer period to start getting meaningful data, and if managers and business people are tingling for an outlook, this will make them nervous. The problem with too fine breakdown is that it becomes an impossible work to manage when the project is larger. A viable approach is to break down the whole project coarsely, and then to break down the “first phase” of the project in fine- grained chunks. This way we can start getting meaningful data quickly at the fine-grained level. As time goes by, we will start getting meaningful data on the coarse level (project level) as well, but we would have not starved people who need forecasting data sooner (whether for comfort or otherwise).

For large projects we should set fine-tuned T-shirt ranges for the first one or two phases and have a coarse T-shirt size for the whole project. Let’s say we are working on a system that consists of 18 modules of similar complexity. We can split each module in 7–10 chunks and measure those against the coarse T-shirt size on the project level.

We can then break the first 3 modules in about 30 pieces each, and size these chunks against the fine-grained T-shirt ranges for the first “phase.” As we move through the first 30 or so fine-grained pieces, we can roughly see if the plan for the first 3 modules is coming along. Later, as we are getting ready with the first 3 modules, we can decide if more fine-grained estimation is needed or if we now have enough confidence to start projecting on the coarse-grained data. At that time we will have completed about 20–30 chunks on the coarse level.

Earlier, we said that a 20–30-piece sample provides for a low statistical confidence. However, we are not observing a project strictly statistically, nor is this the only data reading we will take at the coarse level. We need to be careful to not deceive ourselves with statistics in case we observe large variability. If this happens, we need to reexamine the approach and look for the source of unacceptably high variability. For example, if the M range is 2–3 days, and we observe that some chunks estimated as M get delivered in 0.5 days, but others take 2 weeks, we need to carefully look at the details. If these happen sporadically, we might be okay without corrective action.

OPERATE AT THE RIGHT LEVEL

If the data from the coarse-level tracking and forecasting is telling us that things are not going well, do not attempt to discover a solution for the problems by diving into fine-grained estimation and tracking. Getting tight control on smaller-scale issues will not provide enough project control to recover from larger problems that are already affecting the project.

Plotting a Dot

Mapping. Mapping out the actual implementation data to the initial estimation is the most laborious part of the work. Some project management tools might be able to help, but a simple spreadsheet should be enough.

Let’s say we have a chunk of work estimated as size M and that this means 2–3 weeks at the set resolution. Once we started the implementation work, this chunk of functionality had to be broken down into multiple stories (or tasks, work items, etc.). We need to figure out which stories belong to which chunk of the original breakdown. This can be facilitated by keeping things well organized and labeled (see Figure 4-14). A tool like Jira can help with the labeling/tagging feature. It is important to not confuse chunks with epics.

process groups

Figure 4-14. The challenge with mapping is to properly map the stories that appeared in the process of work back to the originally estimated chunks of scope. Notice the small labels in the “stories identified in the process of work” column. If we have missed tagging the stories appro- priately at the time of their origination, then we need to backtrack and figure out which area of the solution they belong to.

Once we have mapped the completed stories/tasks back to the originally estimated chunks, the product owner needs to assess the level of completeness of each chunk that has some complete work mapped to it (see Figure 4-15). If we have completed three stories against a chunk sized as M, the product owner might feel that 80% of the functionality is covered, or he/she may feel it’s only 40%.

process groups

Figure 4-15. The product owner needs to assess what percentage of the desired solution (represented by the originally identified chunks) is covered by the demonstrated and working functionality of the completed stories

Whether the mapping is trivial or demanding, we should approach it with patience and an open mind. It might take a few hours or even a day, but it is a few hours well spent, and it might also help with learning more about the state of the project. Items we thought were done might turn out to be only half done, and things we thought were scheduled for next release might appear only partially done. It is an opportunity to spot details we might have missed.

Plotting. With all this work out of the way, we can now “calculate” the scope we have covered (Figure 4-16). We are ready to plot the first dot on the forecast graph.

process groups

Figure 4-16. The first data-driven indication on the forecast is applied against the calculated completed scope. The desired project end date and the total estimated scope define two of the project envelope limits at this moment.

Don’t let the crude form of this graph fool you. Its data-driven aspect more than compensates for the small imperfections of a manual drawing. We know where we have started, we know where we are now, and we know where we want to go. We are getting closer to being able to forecast.

The Other Two Pillars

The Central Limit Theorem works very well for the application described so far. But it is not sufficient by itself. There are two other crucially important principles that must be satisfied for us to be able to forecast intelligently. They are “Sustainable pace of work” and “Done.”

Sustainable pace of work. We often see software development teams, who work in an agile style, estimating user stories in story points. The number of points delivered within an iteration is called velocity. Story points and velocity don’t relate directly to the estimation or forecasting for the whole project. One reason for this is that they change meaning throughout the project, as they are affected by what the team learns each iteration.

Another reason is that sometimes we don’t have enough detail to estimate everything in points. Even if we had enough detail, it would not make sense to spend time understanding features and dependencies at the level needed for story points.

However, story points and measuring velocity are of paramount importance for the forecast’s worthiness. Their value is in setting a sustainable pace for the team. A team not working in a sustainable way cannot deliver a project that can be reliably forecasted. One of the three principles on which the method of intelligent forecasting is based is that the team must be capable of working consistently (see Figure 4-17), and story points are a perfect tool for ensuring this consistency.

process groups

Figure 4-17. Statistics alone is not enough to support intelligent forecasting. The project team must be capable of sustaining an optimal pace of work throughout the duration of the project.

Sustainable pace does not necessarily mean a constant pace, as teams typically need time to reach their optimal pace. Teams can also innovate and accelerate. During innovative periods, the pace of delivery might suffer at first and then it can pick up again. There is also normal fluctuation based on the work complexity. As long as the team’s productivity remains within a satisfactory bandwidth, we can consider this mode of operation sustainable (see the diagram on the left in Figure 4-18).

If there are short bursts of output followed by deep troughs of endless bug fixing (see the diagram on the right in Figure 4-18) and zero or negative architectural progress, then the team is not capable of delivering in a sustainable way.