Skip to content
English
On this page

“Time is money!” ——Benjamin Franklin

Sometimes, our favorite websites suddenly become as slow as sloths, leaving us wondering - ‘Is there a problem with my internet?’! Remember waiting an eternity during the Cyber Monday sales for the website to load? Or staring at the loading icon for the train tickets to show up when you are dying to book your Christmas vacation? Or left hanging on the booking page of a blockbuster movie? These are some day-to-day instances where we, as customers, feel intense frustrations due to poor website performance! If you want to save your application’s end-users from such frustrations, you have to continuously measure and improve the performance of your application. This chapter aims to equip you with the essentials around measuring or testing web performance—specifically topics like performance KPIs, API performance testing, front-end performance testing and shift-left performance testing are covered. You will also get a chance to try both front-end and API performance testing hands-on as part of the exercises.

And there is more — Google ranks the slower websites lower in their SEO (Search Engine Optimisation) algorithms, which pushes your website further down into the abyss if it is not performant enough! Maile Ohye states in her online webmasters class in 2010 that Google, one of the best- in-class websites, aims for under a half-second load time.

Losing customers translates to losing sales; indeed, businesses lose a heavy cut. For example, in 2018, Amazon faced a loss of about $72 million when their website failed to handle the Prime Day traffic. Lousy performance, may in turn, lead to a loss of reputation for the brand — especially, when the world is tightly connected over social media, bad reviews spread so rapidly.

On the flip side, a slight increase in performance can result in significant improvement in sales. For instance, in 2016, The Trainline, a train operating company in the UK, reduced load time by 0.3s, and revenue increased by an extra £8 million ($11 million) a year. Similarly, Mobify has observed that every 100-millisecond decrease in homepage load time increased the annual revenue by $380,000. The correlation between sales and performance makes it clear that the first step to improving sales for an online business is to look at their application’s performance. This means we, as software teams, need to build and test for performance early and frequently, i.e., shift your performance testing to the left!

Indeed, one of my primary motivations to focus on website performance early is straightforward - I love my weekends and want to spend them leisurely. Since performance issues are very costly, as you would have observed from the earlier examples, and directly affect the brand reputation, software development teams, usually, are placed under high pressure to fix them ASAP! Forrester’s research showed that software teams that don’t focus on performance at the earliest end up fixing 100% of performance issues directly in production. 4 So, if you do not incorporate performance testing early and often during the SLDC, you can expect to pay for it by working on weekends (and long hours) later to fix the performance issues!

Simple Performance Goals

Performance, in simple terms, is the ability of the application to serve a vast number of concurrent users without significant degradation in its behavior compared to when it is serving only a single user, provided the overall behavior stays within the end-user acceptable limits. So, to test for performance, firstly, you need to seal the expected number of peak-time users for your application and then ensure if the performance is within the end-user acceptable limits.

There are studies to tell us what the end-user acceptable limits are:

  • According to Jakob Nielsen, when the response time of the site is 0.1 second, the user feels the behavior was instantaneous.

  • And, when the response time is 1 second, they feel the delay but are still in control of the navigation on the website.

  • From the Google statistics we saw earlier, beyond 3 seconds you are at a risk of losing the majority of the customers. Google, indeed, recommends to keep the page load time as less than 2 seconds from the second visit onwards.

These are your performance goals. To achieve such good results, a lot of infrastructure tuning and code optimization needs to happen in many iterations before going live—yet another reason to adopt a shift-left performance testing strategy.

Factors Affecting Application Performance

Achieving those performance goals is not that straightforward; businesses wouldn’t have lost so much money otherwise. There are so many factors in an application that challenges the path to achieving these goals. The following are some:

Architecture design

Architecture design plays a vital role in contributing to the performance of a website. For instance, when the services are not sliced appropriately, it will lead to numerous service calls delaying the response time. Similarly, when appropriate caching mechanisms are not implemented at the right levels, it will affect the website performance too.

Choice of tech stack

Different stacks of the application need a varied set of tools. If not considered keenly, the tools may fail to work together coherently, affecting the performance. Though you might have witnessed such let- downs, an example for tech stack impacting performance could be different runtime environments (e.g Java, RUST, Go, C#) having a subtle difference in AWS Lambda cold startup 6 time.

Code Complexity

Bad code often leads to performance issues due to unintentional adoption of complex algorithms, long operations, missed validations, duplicate validations, etc. Consider the case where a search is done with an empty string. What would be optimal is for the search endpoint to do a simple input data validation and fail the request quickly. If not, theservice searches the database and returns an error later, delaying the response time unnecessarily.

Database choice and design

Databases play a key role in defining the application performance. There are various types of databases as discussed in Chapter 5. If your application requires very high performance, choosing a suitable database type and proper organization of data within the database will be critical. For instance, storing the details of a single purchase order in parts across multiple tables will require consolidation and delay the retrieval of the final order. So depending on the domain, structuring the data properly with performance in mind is essential.

Network Latency

The central nervous system for any application is the network. All the components in an application internally access each other via some kind of network communication. So, ensuring good connectivity between components is crucial — be it within the same datacenter or multiple datacenters. Secondly, the end-users across the globe reach the application using their own network (2G, 3G, 4G, Wi-Fi) and that is outside the control of software teams. However, designing the application to cater to such users with weak network connectivity is within the purview of software teams. A good UX design avoiding heavy images and substantial data transfers is important for boosting application performance.

GeoLocation of the application and users

If the users of your website are only from a particular region, then having the website hosted physically closer to the region will reduce the network hops and hence the latency. For example, if the website is for European customers but is hosted in Singapore, there will be multiple to-and-fro network hops to connect to the system. If a website intends to serve customers across the globe, there should be a strategy to replicatethe application’s hosting in closer geolocations (or use CDNs). If you use cloud infrastructure, you should remember to request physically closer machines to the end customers, because a common mistake is getting a machine closer to the development team’s location.

Infrastructure

Infrastructure is the skeleton that supports all the muscles of a system. The power of infrastructure in terms of CPU, memory, etc., will directly impact the system’s ability to take the load. Designing infrastructure to deliver a high-performing system is an art in itself. Infrastructure engineers continuously collect the results of the performance tests as one of the parameters to plan the infrastructure needs of the application.

Third-party integrations

When there are integrations with third-party components, the application is dependent on that component’s performance. Any latency in that component will eventually add to our application’s performance. For example, as discussed in Chapter 3, a typical retail application integrates with many third-party services such as vendor’s product information management systems, warehouse management systems, etc., and in such cases, choosing a performant accomplice is vital.

During performance testing, you should recall these factors in order to simulate real world test cases. For instance, you need to set up a performance testing environment that is very similar to the production environment in terms of network, infrastructure, geolocation, etc., as otherwise, you may not have an accurate measure of performance!

Key Performance Indicators

Measuring/testing the application performance implies capturing the following quantitative key performance indicators (KPIs). When they are measured continuously throughout the development cycle, they will helpthe team to course-correct their way earlier with minor effort. To elaborate the KPIs:

Response time

Response time refers to the time taken by the application to answer a query by the user. For example, the exact time taken to show the results of a product search query to the customer. As we saw earlier, the expected response time for web applications is at ❤️ seconds, beyond which, there is the risk of losing the majority of customers. Note that 3s is the delay experienced by the end-user and thereby includes both the API response time and the time taken by the front-end to load.

Concurrency/Throughput

Websites are accessed by numerous users from across the globe at a given point in time. Indeed, some of the high-speed applications such as the stock exchange sites cater to millions of transactions in a second. Establishing that the application can support a given volume of users within the acceptable limits at a given point in time is referred to as measuring concurrency. For example, validating if the application can respond within 3 seconds for 500 concurrent users.

Although ‘concurrent users’ is a commonly used term by the businesses and teams, when we think from the system’s perspective, it receives various requests from end-users and other components, which are queued and picked for processing one after the other by a few parallel threads. Hence, the number of concurrent users indicator doesn’t sit well while thinking from the system’s perspective. A better indicator to measure here will be the ‘throughput.’ Throughput measures the number of requests the system can support during an interval of time.

To understand this better, consider the analogy of cars crossing a very short bridge on a highway in respective car lanes. Let’s say there are four car lanes. Given the type of car, it can swiftly pass the bridge in the range of a few hundred milliseconds. So in a second, the total number ofcars crossing the bridge will be 30 to 40. This value of 30 cars per second is the throughput.

Concurrency and throughput are both helpful in server capacity planning and are often used in different contexts to make impactful decisions.

Availability

‘Availability’ is a measure of the system’s ability to respond to the end- users at the same acceptable limits for a given continuous period. Typically, the websites are expected to be available 24/7 except for planned maintenance. Availability is an essential criterion to test because the applications may perform well for the first half-hour and then responses could degrade over time due to memory leakage, overconsumption of the infrastructure capacity by parallel batch jobs and many such unpredictable reasons.

Now that we have discussed the KPIs, let’s understand how to measure them.

Types of Performance Tests

To measure the KPIs, you need to specifically design the performance tests in a certain fashion. The following list describes three of the common types or designs of performance tests:

Load/Volume tests

As discussed earlier, concurrency/throughput is to validate if the application can serve the expected volume of users. For instance, the search functionality should respond within 2 seconds for a volume of 300 users. The performance test to simulate the volume and validate if the application meets the expected target response time is called the ‘volume test.’ You may have to repeat such tests multiple times toobserve consistency and measure the average to benchmark the application.

Stress tests

A commonly observed behavior is that an application’s performance starts degrading as more users are stressing it. For example, it performs within acceptable limits for X users; beyond X users, it starts to respond with delays and finally, at X+n users, it responds with errors. You need the exact measure of these figures. This measure will be used in planning the infrastructure while scaling the application to new countries or during sales. The performance test design will be to slowly increase the load on the application in small steps beyond the volume test limits, and to study precisely where it responds with errors. This process of stressing the system to find the breaking point is called ‘stress testing.’

Soak Tests

When the application runs with a good volume for a while, there may be degradation in response time due to infrastructure issues or memory leakage, etc. The performance test designed to keep the application under a constant volume of load for an extended period and observing the behavior is called the ‘soak test.’

While designing these tests, an important point is to keep them realistic and avoid overheating the application with extreme situations that may never occur. For instance, not all users will log into the application at the same instance of time. A more realistic use case will be the users logging in gradually with a few milliseconds gap in between. This is called the ‘Ramp- Up.’ Your test cases should include such a practical design; let’s say, ramp- up 100 users in 1 minute.

Further, users aren’t robots to finish logging in, searching a product, and buying a product within milliseconds. But performance test cases might be designed that way unintentionally. In reality, users take at least a few seconds to think between their actions and take minutes to complete a transaction like buying a product after logging in. This is called the ‘think time’ in performance testing terms. You need to include appropriate think time in your test cases to spread the user actions apart a few seconds or minutes. Related to think time is another concept called ‘pacing’, which defines the time between transactions (not user actions). In real life, transactions could be initiated again by the same user post a fixed time. So, if you’re expecting 1000 transactions per hour during peak hour sales, you can spread the transactions over the hour by configuring the pacing time. These three attributes have to be played with wisely to measure an application’s performance realistically.

Types of Load Patterns

We spoke about the different types of performance tests in order to measure the KPIs. The performance tests in turn translate to generating different load patterns on the application. To recollect, the four key parameters that lend themselves to simulate different types of load patterns on the application are the ramp-up time, think time, the number of concurrent users and pacing. We shall discuss some of the commonly tested load patterns in this section.

Steady Ramp-Up Pattern

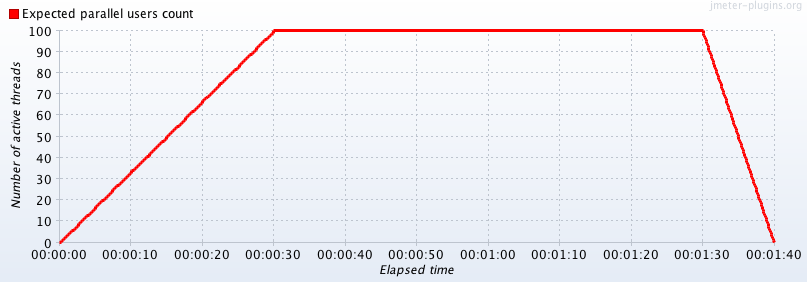
In the steady ramp-up pattern, the users are steadily ramped up within a given period, and then the load is maintained constantly for a sustained period to measure performance. Refer to Figure 7-1. This is typically the scenario in most real-world applications, for example, the Black Friday sales, where the users gradually but steadily come into the application and stay there for a while before dropping out steadily.

Frameworks

Step Ramp-Up Pattern

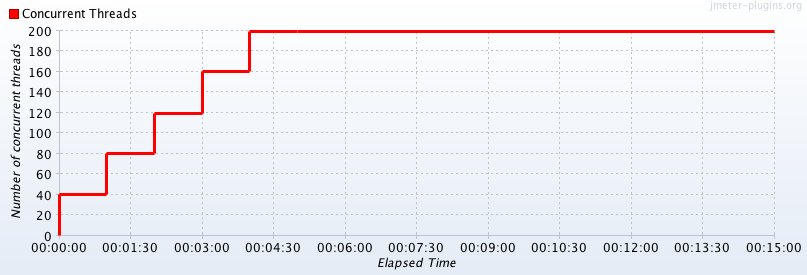
With the step ramp-up pattern, users are ramped up in batches periodically. For example, 100 users every 2 minutes. Refer to Figure 7- 2. This is to observe and measure the application’s performance for each step count of users, which will help benchmark the application for different loads. Step Ramp-Up pattern will be used in performance tuning and infrastructure capacity planning.

Frameworks

Peak-Rest Pattern

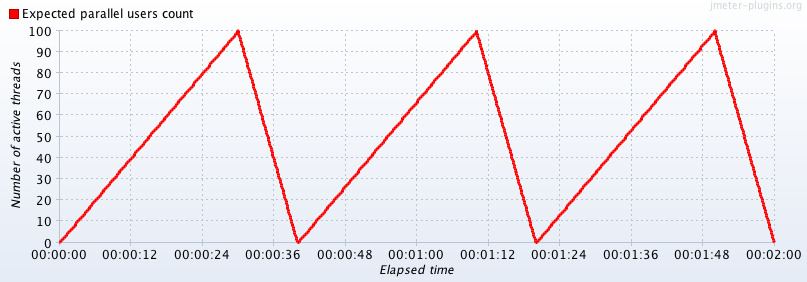
The peak-rest pattern is when the system is ramped up to reach peak load and then ramped down to complete rest in repeated cycles. Refer to Figure 7-3. This scenario could be true in some applications like social networking, where the peak comes and goes in cycles in a day.

Frameworks

Performance testing tools lend a hand in generating these patterns easily, which we shall see later in the chapter.

Performance Testing Steps

Now that we’ve discussed the KPIs, performance test types and load patterns, next is to navigate through the performance testing steps and actually doing an exercise. The steps described here mainly will help you plan the necessary time and capacity needed for performance testing in your project.

Step1: Define the target KPIs

The step one is defining the target KPIs based on business needs. The best way to start thinking about the target numbers is to think about them qualitatively and then translate them into numbers. 7 For instance, qualitative thinking about performance could lead to goals such as:

  • The application should be able to scale to one more new country.

  • The application should perform better than its competitor X.

  • The new application should do better than its last version.

These qualitative goals naturally lead towards the next steps. If the goal is to do better than the last version of the application, you need to measure the performance numbers of the earlier version and see if your current numbers are better. Similarly, if you know the competitor’s performance numbers, you need to validate that your numbers are better than them.

  • If there is an existing application, analyze the production data to arrive at KPIs and load patterns.

  • If you are building a new application, ask for competitors’ data.

  • If the application is completely new with no reference data, still use data around country wise internet usage, probable peak duration, etc., to work out your target KPIs.

Step 2: Define the test cases

The second step is to list down the performance test cases using the load patterns and the performance test types semantics. Your test cases should mandatorily cover measuring the availability, throughput, and response time of all the critical endpoints in the application. The performance test cases will subsequently reveal the test data setup needed to run the test cases. At the end of the day, your performance test cases may only be a handful unlike functional test cases.

Step 3: Prepare the performance testing environment

As mentioned earlier, the performance testing environment should be as close to the production environment so that you can get realistic results and also identify performance bottlenecks, if any, in environment configurations.

  • Here is a checklist to make it as close to the production environment:

  • The respective tiers/components need to be deployed in a similar fashion as in production.

  • Machine configurations like the number of CPUs, memory capacity, OS version, etc., should be similar.

  • The machines should be hosted in the respective geolocation in the cloud.

  • Network bandwidth between machines should be similar.

  • Application configurations like rate limiting should be precisely the same.

  • If there will be batch jobs running in the background, those should be in place. If there are emails to be sent, those systems should be in place too.

  • Load balancers, if any, should be in place.

  • Third-party software should be available at least in a mocked capacity.

Getting such a production-like environment is often challenging due to additional costs involved, although cloud provisions are cheaper. It is a matter of cost vs. value conversation with the business. If you don’t win that battle, prepare to make meaningful tradeoffs on the performance environment setup and raise to the respective stakeholders that the performance numbers measured with such tradeoffs might not be foolproof.

Apart from the performance testing environment, you also need a separate machine to be the test runner, i.e., to run the performance tests. Plan to have individual test runners hosted in different geolocations (this is possible with cloud providers) to observe the respective performance behaviors with network latencies from multiple countries, if your application is intended to serve a global audience.

Step 4: Prepare the test data

Just like how the performance testing environment should be as close to the production environment, the test data should be as reflective as the production data. The performance numbers that you will measure will greatly depend on the test data quality and hence this is a critical step. An ideal situation will be to use the same production data after anonymizing the sensitive user information as it will reflect the actual database size andcomplexity of data. However, you may find blockers in getting the real production data due to security issues in certain situations. In such cases, prepare the test data that could closely mimic the production data.

A few pointers while creating production alike data are:

  • Estimate the size of the production database (e.g., 1 GB or, 1 TB) and set up scripts to populate the test data. It may be necessary to clean and repopulate the test data for every test run. So, having the test data creation and cleaning up scripts will be crucial.

  • Create a variety of test data similar to production. Instead of ‘Shirt1’, ‘Shirt2’ etc., use actual production-like values such as ‘Van Heusen Olive Green V-Neck Tshirt.’

  • Populate a fair share of erroneous values like addresses with spelling mistakes, blank spaces, etc., that might represent actual user inputs.

  • Have a similar distribution of data across factors like age, country, etc.

  • Based on the test cases, you may have to create a lot of unique data like unique credit card numbers, login credentials, etc., to run volume tests with concurrent users.

Yes, preparing the test data can be a tedious job! These activities need to be planned well ahead of time in the release cycle. It’s impossible to squeeze it in later as an afterthought and if you did, the test data might not be of good quality resulting in inaccurate performance numbers.

Step 5: Integrate APM tools

The next step is to integrate application performance monitoring (APM) tools (e.g., New Relic, Dynatrace, Datadog) so that you can see how the system behaved during the performance tests. These tools greatly help in debugging performance issues, if any. For instance, requests may fail duringperformance test runs due to insufficient memory in the machine, which the APM tools will expose easily.

Step 6: Script and run the performance tests using tools

The last step is to script the performance test cases using tools and run them against the performance testing environment. There are many tools to script and run the performance test cases in a single click and also integrate them with CI to help us shift-left. JMeter, Gatling, k6, Apache Benchmark (ab) are some of the popular kids in this playground. These are open-source tools. There are also commercial cloud-hosted tools like Blazemeter, Neoload, etc. Some of these tools provide simple user interfaces to configure the performance tests and don’t require coding. You can get test run reports with graphs, while commercial tools even offer a dashboard view. An exercise to create test scripts using JMeter and integrate them with CI is included in the exercises section.

Performance test runs may actually take time from a few minutes to a few hours depending on the test. So, do a dry run of the scripts with a lesser user count before starting the full fledged test run.

Those are the six steps in performance testing and we shall apply them as part of an exercise in the next section. The key to successfully execute all the six steps in your project is to plan capacity for them adequately as mentioned earlier. While planning, also include time and capacity to collect test run reports, debug and fix performance issues, and do server capacity tuning, which will complete the entire performance testing cycle!

Front-End Performance Testing

Though performance testing tools allow you to mimic application behavior during peak time, there is a gap between the measured performance numbers and the actual user experienced performance. This is because the tools are not actual browsers and they don’t do all the tasks a typical browser does!

To understand the gap, let us explore a bit about browser behaviors. As we saw in Chapter 6, the front-end code getting rendered on the browsers has three parts to it:

  • HTML code, which is the bare bone structure of the website
  • CSS code which styles the page
  • Scripts to create logic on the page

A typical browser first downloads the HTML code entirely from the server then gets to downloading the stylesheet, images and executing the scripts as per the sequence in the HTML. There is parallelization to an extent when it is downloading images from different hosts etc. But the browser stops parallel processing completely when executing a script as it is possible for the script to change the way the page is made visible entirely. Since there could be scripts at the end of the HTML, the page becomes visible for the user only when the entire document is fully executed.

Performance testing tools don’t do most of these jobs. They hit the page directly and get the HTML code, but they don’t render the page while executing the performance tests. So even when you have measured the services’ response time to be within milliseconds, the end-user will see the page appear only after a further delay because of the additional rendering tasks, which the browser does. According to Yahoo!, this front-end rendering takes almost 80% of the entire page load time! 8 Isn’t it shocking?

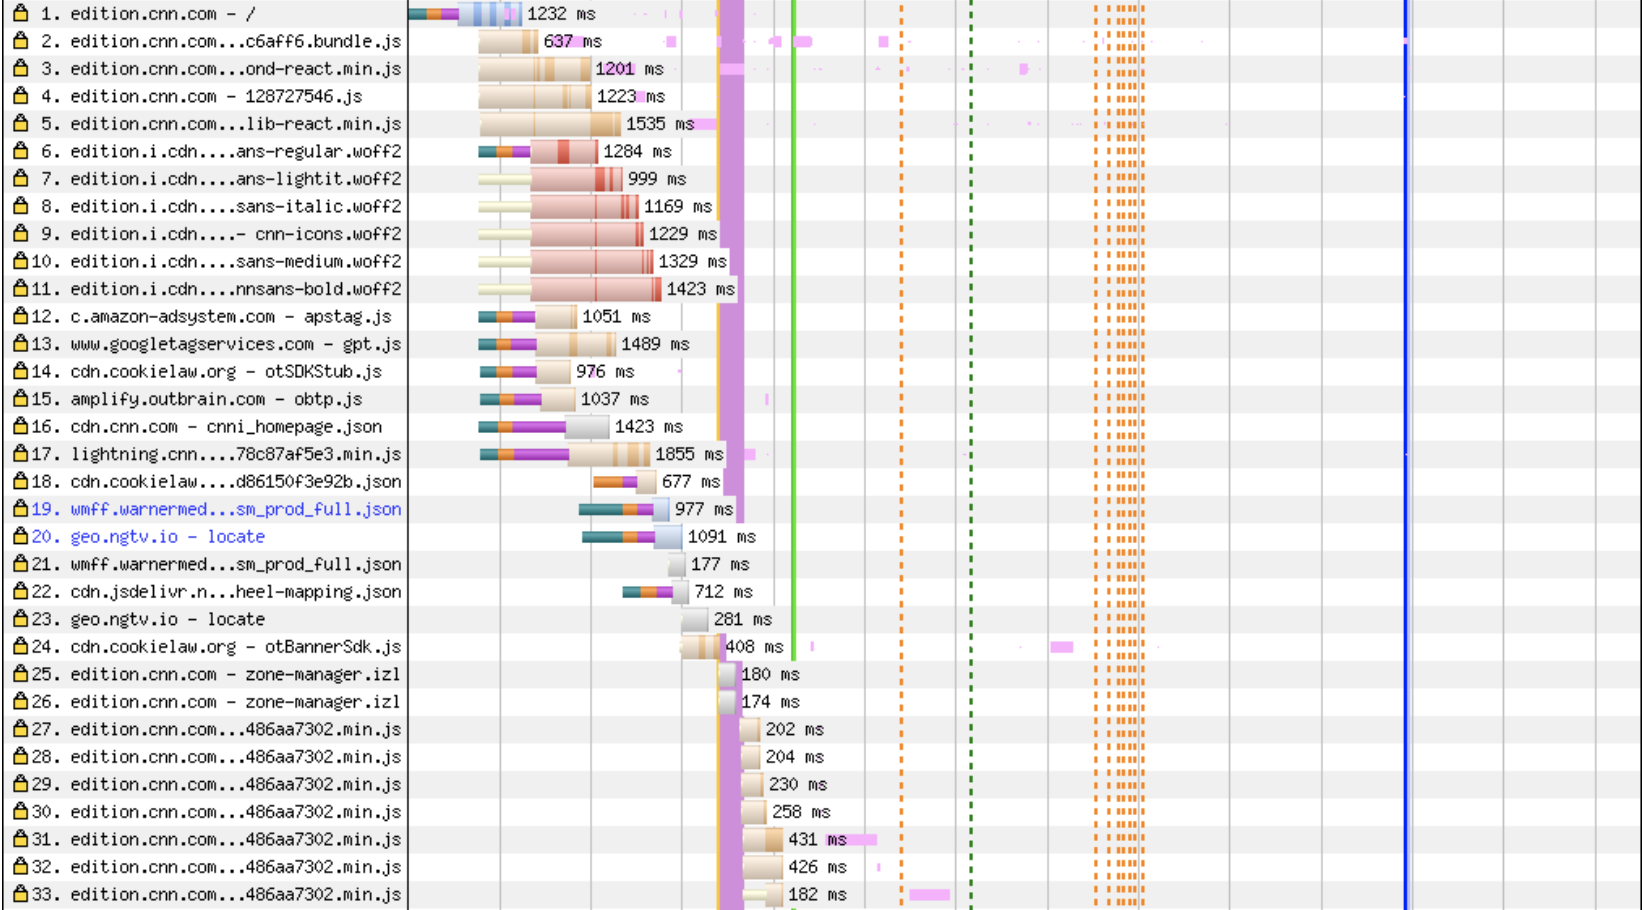
For example, if you navigate to the CNN home page, the browser will carry out 90 tasks before the page appears to us. Figure 7-13 shows the first 33 of these tasks. If you had been thinking optimizing the web service’s response time alone would create an impact on website performance, here is a piece of evidence for changing that view!

Frameworks

However, the KPIs described and measured as part of the exercises earlier are still relevant and critical. Those are vital to plan the system’s capacity and troubleshoot performance issues. In other words, they help you to answer questions like “Will the application support a peak load of 5,000 transactions during Black Friday sales?”. But if you find from the KPIs that the peak response time for the application is ~1.5seconds, it still may not be the actual experience of an end-user. Here is where you have to evaluate the front-end performance metrics additionally. That is what we will discuss in this section.

Building Blocks

To begin with, let’s understand the factors specifically affecting the front- end performance and the metrics that need to be measured for quantifying front-end performance. Later you can get hands on with actually measuring them as part of the exercises.

Factors Affecting Front-End Performance

There are several factors that particularly contribute to front-end performance such as the following:

Front-end code complexity

Best practices such as minifying the Javascript, reducing the number of HTTP requests made per page, proper caching techniques, etc., which, when not followed properly, will lead to lower performance. For instance, each HTTP request takes at least a few milliseconds to respond and if the page has to make many requests, the response time of every request adds up to the total page load time.

Content Delivery Networks (CDNs)

A Content Delivery Network (CDN) is a collection of servers hosted across multiple locations to deliver web content, such as images, to users more efficiently. As we discussed earlier, the geolocation of theserver and the user has an impact on application performance due to network latency. To reduce the network latency, the images are stored in CDNs, which will have a server physically closer to the user. This is much simpler than replicating the application in different geolocations. But the performance of the CDN itself will affect the page load time.

DNS lookups

It typically takes 20–120 milliseconds for a browser to look up the IP address for a given hostname. Once the DNS is resolved the first time, the browser and the OS caches the IP addresses reducing the page load time for subsequent visits. Even the Internet Service Provider caches the IP addresses for a while contributing to performance improvements. However, the first time user experience is affected by the DNS lookups.

Network latency

The user’s network bandwidth majorly calls the shots on the overall page load time. As per the global usage data discussed earlier in Chapter 6, mobile usage trumps desktop. The mobile network bandwidth especially tends to be very low at times both in urban and rural areas. Some sites overcome this by serving a ‘lite’ version of their website when they identify the bandwidth to be low. On the other hand, it is studied that the users who generally operate with low bandwidth like 3G are used to the slowness and don’t complain unless the performance is jarringly bad.

Browser caching

The browser caches many contents like images, cookies, IP addresses, etc., after the first visit. Due to which, the page load time significantly varies from the first time it renders to the subsequent usages. Browser cache can be made intentional via code to improve page load time.

Data transfers

If volumes of data get transferred to and fro between the user and the application, obviously it will affect the overall front-end performance given the network’s effects adding to it.

All these factors could make us feel like they are beyond the team’s control to even think about optimizing them, leaving a puzzle in our heads about where to start! Many folks in the software industry have also felt the pain of dealing with this challenge. That’s where the RAIL model comes in.

RAIL Model

The RAIL model is a way to structure the thought process around front-end performance.

It is designed with the principle of keeping the end-user’s experience at the core of front-end performance and quantifies goals for front-end performance. It will be convenient to view the front-end performance through this lens and integrate the goals as part of testing. The RAIL model breaks down an end-user’s experience on a website into four key aspects: response, animation, idle, and load, which are elaborated further here. Every other user interaction can be measured along these aspects.

Response

Have you had the experience of clicking on a button, and it neither changed color nor popped a loading icon, making you wonder if you imagined clicking that button in the first place? That is the input latency. The ‘response’ aspect of RAIL defines the goals for input latency. When a user does an action on the website such as clicking a button, toggling an element, selecting a checkbox, etc., RAIL prescribes the response time for the action to be less than 100 milliseconds; failing which the user will sense the lag!

Animation

Similarly, the user will perceive a lag in animation effects (e.g., loading indicators, scrolling, drag, and drop, etc.,) when each frame is not completed within 16 milliseconds.

Idle

One of the general front-end design patterns is to group non-critical tasks like beaconing back analytics data, bootstrapping a comments box, etc., to later when the browser is idle. This grouping of tasks can be bundled to make blocks of 50 milliseconds, as recommended by RAIL and not more, so that when the user comes back to interact, you can respond within the 100-milliseconds window.

Load

This refers to the page loading time. A high-performing website should aim to render the page within 1 second as only then users feel they are in complete control of the navigation, as per the research mentioned earlier.

As we can see, the RAIL model guides us to think about what to test for from a front-end performance perspective. It also gives a concrete language to communicate within teams instead of expressing vague feelings like the ‘page seems slow’!

Front-End Performance Metrics

In practice, the high-level goals set by the RAIL model are broken down into smaller, tinier metrics in order to fine tune debugging of performance issues. A set of standard front-end performance metrics adopted in the industry are as follows:

First Contentful Paint

It is the time taken by the browser to render the first element on the DOM such as the images, non-white elements, SVGs, etc. This helps us understand how long the user has to wait to see some action on the website after opening it.

Time to Interactive

It is the time taken for the page to become interactive. In the urge to make the page performant, the elements could be made visible quickly but could fail to respond to user’s actions leading to frustration. Hence in parallel to measuring the time taken to see the first content on the website, the ‘time to interactive’ helps us understand if the information presented is helpful or just noise.

Largest Contentful Paint

The time taken for the most prominent element like a big blob of text or image on the web page to become visible.

Cumulative Layout Shift

Have you ever come across sites where you started reading an article and the page automatically shifted down, making you lose track of what you were reading? It is frustrating, isn’t it? This metric aims to measure the visual stability of the page and quantifies how often the user faces an unexpected change in page layout. The lower the number, the better is the performance.

First Input Delay

Between the first contentful paint and time to interactive, when the user clicks on a link or makes any interaction on the web page, there will be a delay which is more than the usual delay because the page is still loading. This metric gives that time delay for the first interaction.

Max Potential First Input Delay

This measures the worst-case scenario of the first input delay. It measures the time taken by the most prolonged task that occurs between the first contentful paint and the time to interactive to complete.

Google classified the Largest Contentful Paint, First Input Delay, and Cumulative Layout Shift as the ‘Core Web Vitals’ to help the business folks understand their site’s performance in simple terms. 10 Most of the front-end performance testing tools capture these three metrics specifically. We can use the tools to continuously measure these metrics as part of CI and hence shift front-end performance testing to the left. Let’s discuss how to do that next.

Performance Testing Strategy

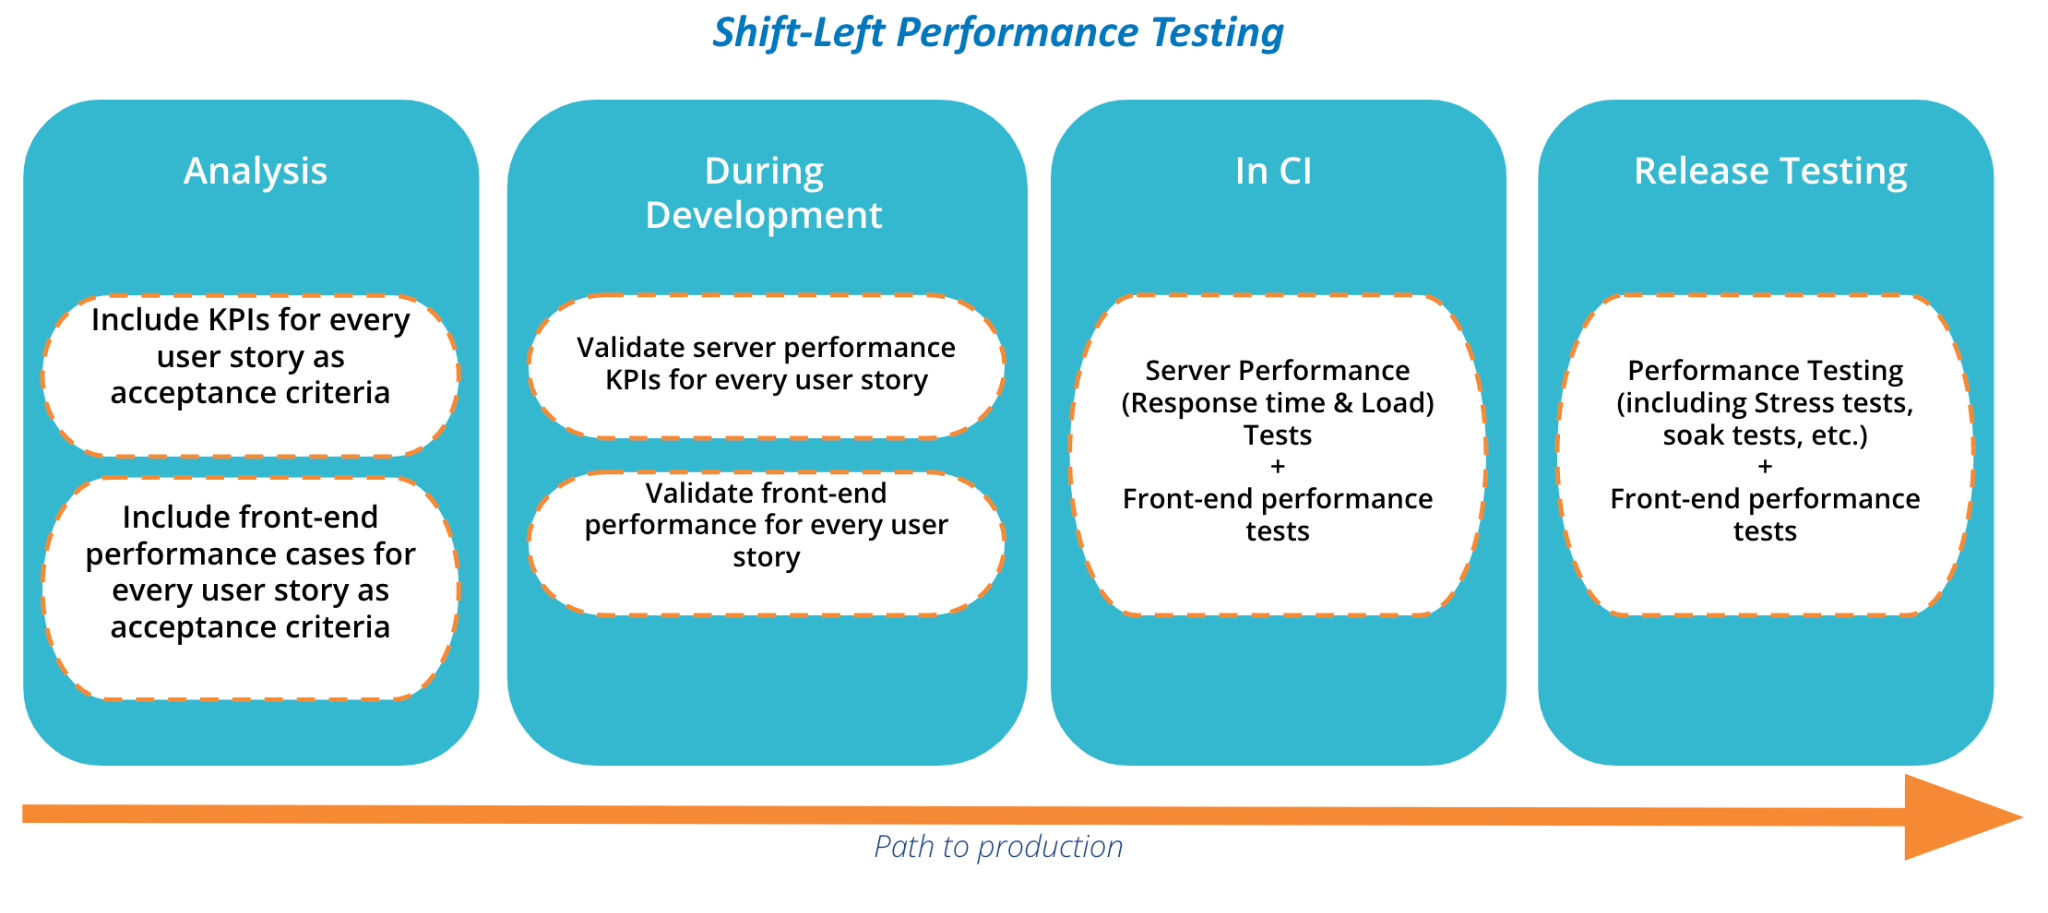
As mentioned a few times throughout the chapter, shift-left should be the principle behind your performance testing strategy. Shifting left should start from designing the architecture befitting the expected performance numbers to integrating performance tests in CI pipelines for frequent and continuous feedback. Recalling how this will be profitable for the business, congenial to the end-users and favorable for your weekend plans. Figure 7-21 shows an overview of shift-left performance testing strategy, which applies the fundamentals discussed in this chapter.

Frameworks

A walkthrough of the different phases in shift-left performance testing is as follows:

At the planning phase:

  • Arrive at a consensus on performance KPIs with all the application stakeholders including the business, marketing, and technical folks before the project starts. Design the architecture, choose the tech stack and other details based on these numbers.

  • Get a performance testing environment at the beginning of the project. If not close enough to production, at the least have an environment to begin.

  • Include various front-end performance test cases (like network, geolocation, etc.) as part of every user story’s acceptance criteria (AC).

  • Include the expected KPIs (response time, concurrency and availability) of the APIs as part of every user story’s acceptance criteria.

During development:

  • Validate the respective server KPIs (response time and load testing of the endpoints) for every user story.

  • Validate front-end performance test cases for the user story.

In CI:

  • Run all the response time validation tests for every commit. Based on the time taken to run the load tests, run them for every commit or as nightly regressions to catch performance issues early. This will also help you see how the performance degrades gradually as you add more features and will help in debugging later.

  • Include front-end performance tests for the frequently visited pages as part of CI pipelines.

During user story testing:

  • Have an eye for visible performance bottlenecks during exploratory testing of different test cases.

  • Ensure the performance related ACs are met, automated and integrated with CI before marking the user story as complete.

And finally, during the release testing phase:

  • Complete the end-to-end application performance testing including stress testing and soak testing as well as debugging activities.

  • Before this stage, strive to get a production-like performance testing environment. If the previous phases are executed accurately, this phase should run the tests on the performance testing environment without many surprises.

As you would have digested by now, performance testing takes significant effort and can’t be introduced in your release cycles abruptly as an afterthought without disrupting the timelines!

Key Takeaways

Here are the key takeaways from this chapter:

  • Web performance has a sharp impact on the sales of the business to an extent of losing several million dollars when it is poor.

  • Plenty of diverse factors such as architecture, third-party service’s performance, network bandwidth, user’s geolocation, etc., influences an application’s performance. These factors keep oscillating throughout the software delivery cycle and sometimes can become mutually exclusive, posing a tough challenge to the software teams.

  • Measuring the KPIs: availability, concurrency/throughput, and response time continuously from the beginning of the delivery cycle will help in preventing major performance issues in production.

  • Several tools such as JMeter, Gatling, Apache Benchmark, etc., are available in the market to perform shift-left performance testing. Focussing separately on front-end performance is essential as it is noted that 80% of the application’s load time is contributed exclusively by the front-end code.

  • The RAIL model by Google provides a thinking lens for front-end performance, which can be used for defining your front-end performance metrics.

  • Design your front-end performance test cases with the end-user’s experience at core. Include different end-user variables like network bandwidth, geolocation, device capabilities, etc., while testing for front-end performance.

  • Include both API and front-end performance tests in your CI and save yourselves from big-bang performance surprises!

  • Like any other skill, performance testing skills can be developed with practice.